Election
 Matt Miller
 Chris Buchbinder
In a year when soaring inflation, the war in Ukraine and a bear market have commanded headlines, the U.S. midterm elections risked becoming an afterthought. But now the election is coming back into focus. And with good reason. Capital Group political economist Matt Miller believes 2022 could be one of the more consequential midterm elections in U.S. history.
“Make no mistake, every move in Washington this year has been carefully calculated with the midterms in mind,” Miller says.
But while control of the U.S. Congress may be at stake, do midterm elections have any effect on equity markets?
To find out, we examined more than 90 years of data and found that the answer is yes, markets have behaved differently during midterm election years. Here are five things you need to know about investing in this political cycle.
1. The president’s party typically loses seats in Congress
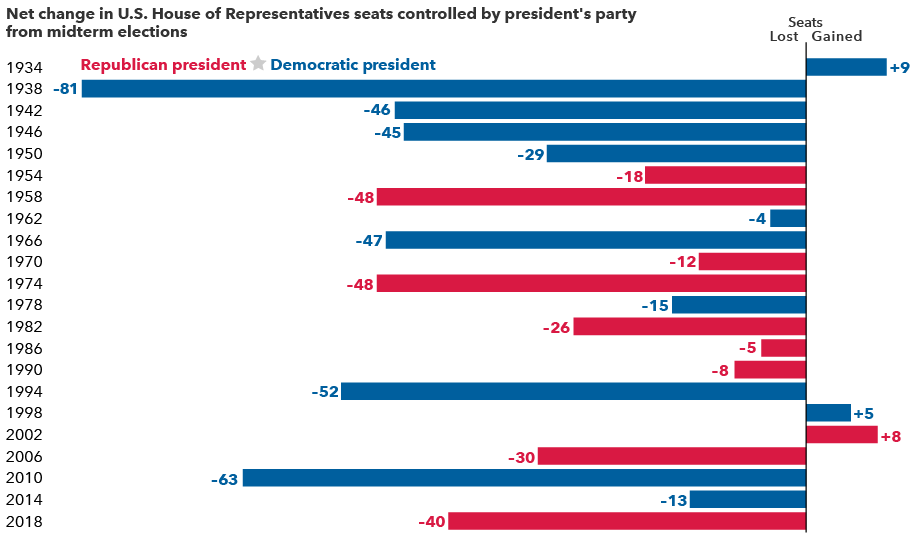
Source: The American Presidency Project, "Seats in Congress Gained/Lost by the President's Party in Mid-Term Elections.”
Midterm elections occur at the midpoint of a presidential term and usually result in the president’s party losing ground in Congress. Over the past 22 midterm elections, the president’s party has lost an average 28 seats in the House of Representatives and four in the Senate. Only twice has the president’s party gained seats in both chambers.
Why is this usually the case? First, supporters of the party not in power usually are more motivated to boost voter turnout. Also, the president’s approval rating typically dips during the first two years in office, which can influence swing voters and frustrated constituents.
“The Senate remains a toss-up, but history suggests we will see a backlash against the party in power that will result in Republicans taking back control of the House,” Miller says. “As far as investors are concerned that would end any chance for ambitious Democratic legislation the next two years."
Since losing seats is so common, it’s usually priced into the markets early in the year. But the extent of a political power shift — and the resulting policy impacts — remain unclear until later in the year, which can explain other trends we’ve uncovered.
2. U.S. market returns tend to be muted until later in midterm years
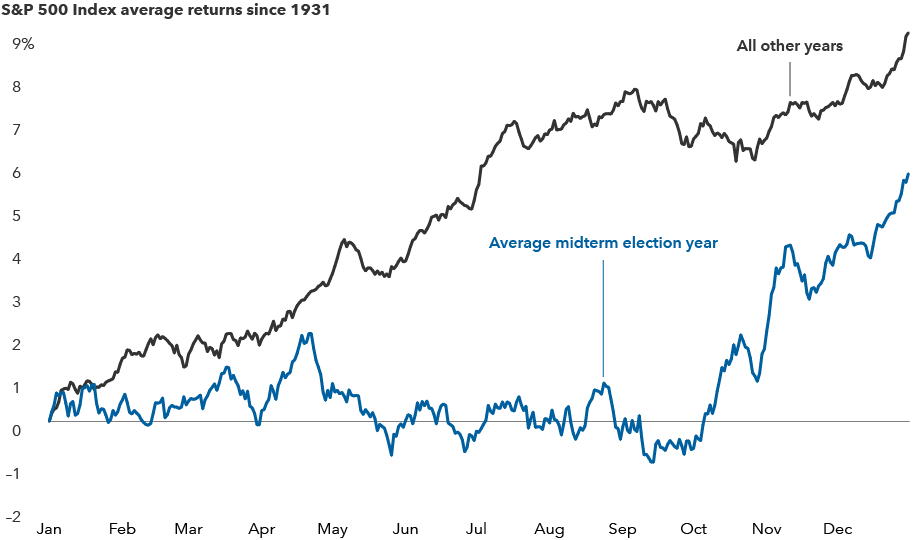
Sources: Capital Group, RIMES, Standard & Poor’s. The chart shows the average trajectory of equity returns throughout U.S. midterm election years compared to non-midterm election years. Each point on the lines represents the average year-to-date return in USD as of that particular month and day and is calculated using daily price returns from 1/1/31–12/31/21.
Our analysis of returns for the S&P 500 Index since 1931 revealed that the path of stocks throughout midterm election years differs noticeably compared to all other years.
Since markets typically rise over long periods of time, the average stock movement during an average year should steadily increase. But we found that in the first several months of years with a midterm election, stocks have tended to have lower average returns and often gained little ground until shortly before the election.
Markets don’t like uncertainty — and that adage seems to apply here. Earlier in the year there is less certainty about the election’s outcome and impact. But markets have tended to rally in the weeks before an election, and they have continued to rise after the polls close. So far, 2022 has been another example of a midterm election year with lacklustre returns, although the impact of politics has been minimal compared to that of inflation and rising rates.
Despite the uncertainty, investors shouldn’t sit on the sidelines or try to time the market. The path of stocks varies greatly each election cycle, and the overall long-term trend of markets has been positive.
3. Midterm election years have had higher volatility
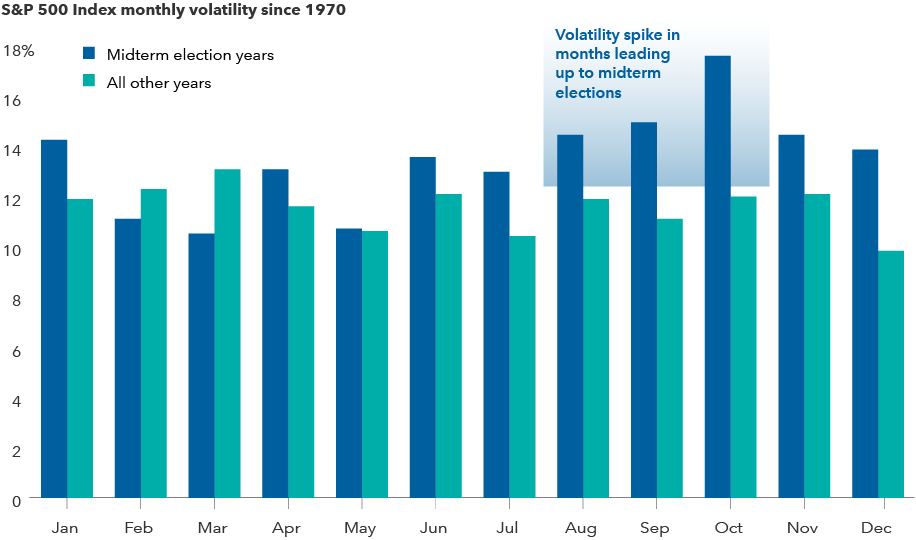
Sources: Capital Group, RIMES, Standard & Poor's. As of 12/31/21. Volatility is calculated using the standard deviation of daily returns in USD for each individual month. Standard deviation is a measure of how returns over time have varied from the average. A lower number signifies lower volatility. Median volatility for each month is displayed on an annualized basis. Based in USD.
Elections can be tough on the nerves. Candidates often draw attention to the country’s problems, and campaigns regularly amplify negative messages. Policy proposals may be unclear and often target specific industries or companies.
It may come as no surprise then that U.S. market volatility is higher in midterm election years, especially in the weeks leading up to Election Day. Since 1970, midterm years have a median standard deviation of returns of nearly 16%, compared with 13% in all other years.
“I don’t think this election will be any different,” says Chris Buchbinder, a portfolio manager on Capital Group U.S. Equity FundTM (Canada) “There may be bumps in the road, and investors should brace for short-term volatility, but I don’t expect the election results to be a huge driver of investment outcomes one way or the other.”
4. Market returns after midterm elections have been strong
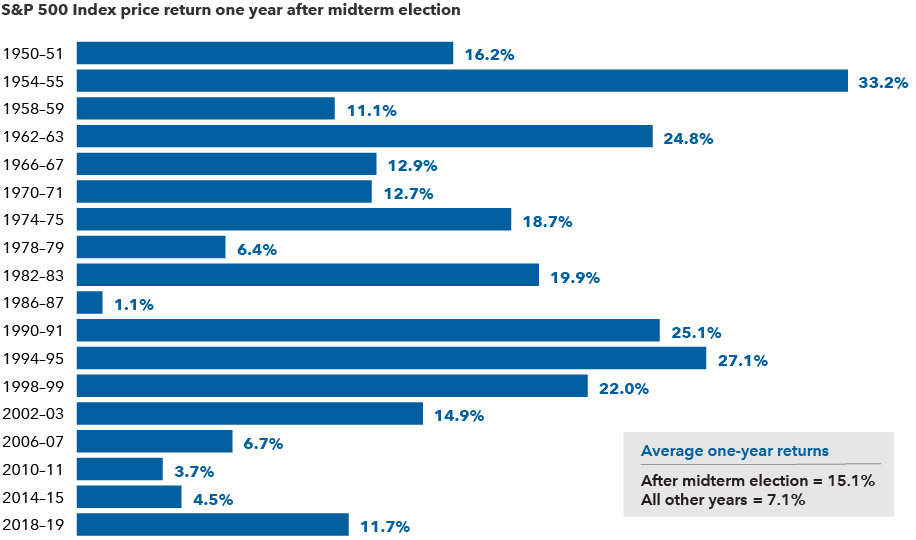
Sources: Capital Group, RIMES, Standard & Poor's. Calculations use Election Day as the starting date in all election years and November 5th as a proxy for the starting date in other years. Only midterm election years are shown in the chart. As of 12/31/21. Returns are in USD.
The silver lining for investors is that markets have tended to rebound strongly in subsequent months, and the rally that has often started shortly before Election Day hasn’t been just a short-term blip. Above-average returns have been typical for the full year following the election cycle. Since 1950, the average one-year return following a midterm election was 15% in U.S. dollar terms. That’s more than twice the return of all other years during a similar period.
Of course every cycle is different, and elections are just one of many factors influencing market returns. For example, over the next year investors will need to weigh the impacts of a potential U.S. recession and global economic and geopolitical concerns.
5. Stocks have done well regardless of the makeup of Washington
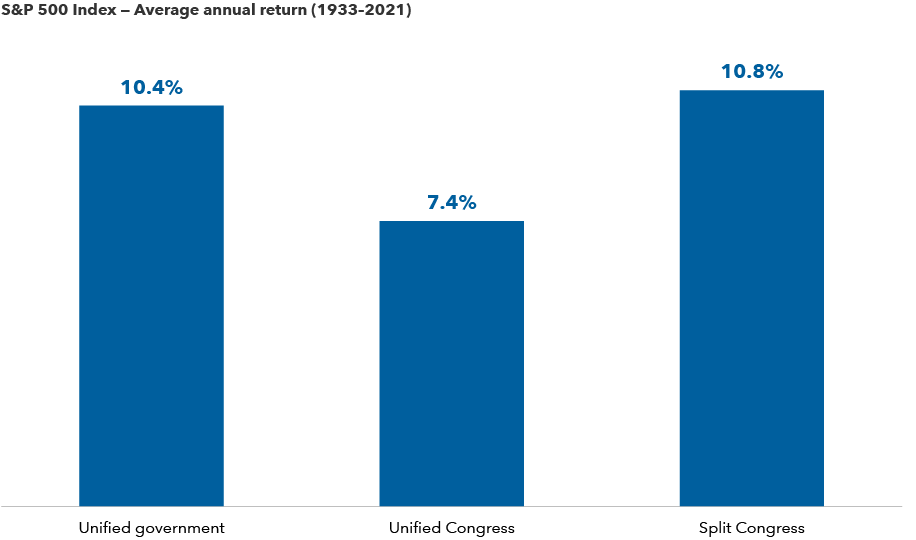
Sources: Capital Group, Strategas. As of December 31, 2021. Unified government indicates control of the White House, House and Senate by the same political party. Unified Congress indicates control of the House and Senate by the same party, but control of the White House by a different party. Split Congress indicates control of the House and Senate by different parties, regardless of White House control.
There’s nothing wrong with wanting your preferred candidate to win, but investors can run into trouble if they place too much importance on election results. That’s because, historically, elections have had little impact on long-term investment returns.
In 2020, many investors feared the “blue wave” scenario, or Democratic sweep. But despite these concerns, the S&P 500 rose 42% in the 14 months following the 2020 election (from November 4, 2020, through January 3, 2022) in U.S. dollar terms.
Going back to 1933, markets have averaged double-digit returns in all years that a single party controlled the White House and both chambers of Congress. This is just below the average gains in years with a split Congress, a scenario which many believe is a strong possibility this year. Even the “least good” outcome — when the president’s opposing party controls Congress — notched a solid 7.4% average price return.
What’s the bottom line for investors?
Midterm elections — and politics as a whole — generate a lot of noise and uncertainty.
Even if elections spur higher volatility there is no need to fear them. The reality is that long-term equity returns come from the value of individual companies over time. Smart investors would be wise to look past the short-term highs and lows and maintain a long-term focus.
Standard & Poor‘s 500 Composite Index is a market capitalization-weighted index based on the results of approximately 500 widely held common stocks. The market index is unmanaged and, therefore, has no expenses. Investors cannot invest directly in an index.
Our latest insights
-
-
Currencies
-
Market Volatility
-
Market Volatility
-
Markets & Economy
RELATED INSIGHTS
Commissions, trailing commissions, management fees and expenses all may be associated with investments in investment funds. Please read the prospectus before investing. Investment funds are not guaranteed or covered by the Canada Deposit Insurance Corporation or by any other government deposit insurer. For investment funds other than money market funds, their values change frequently. For money market funds, there can be no assurances that the fund will be able to maintain its net asset value per security at a constant amount or that the full amount of your investment in the fund will be returned to you. Past performance may not be repeated.
Unless otherwise indicated, the investment professionals featured do not manage Capital Group‘s Canadian investment funds.
References to particular companies or securities, if any, are included for informational or illustrative purposes only and should not be considered as an endorsement by Capital Group. Views expressed regarding a particular company, security, industry or market sector should not be considered an indication of trading intent of any investment funds or current holdings of any investment funds. These views should not be considered as investment advice nor should they be considered a recommendation to buy or sell.
Statements attributed to an individual represent the opinions of that individual as of the date published and do not necessarily reflect the opinions of Capital Group or its affiliates. This information is intended to highlight issues and not be comprehensive or to provide advice. For informational purposes only; not intended to provide tax, legal or financial advice. Capital Group funds are available in Canada through registered dealers. For more information, please consult your financial and tax advisors for your individual situation.
Forward-looking statements are not guarantees of future performance, and actual events and results could differ materially from those expressed or implied in any forward-looking statements made herein. We encourage you to consider these and other factors carefully before making any investment decisions and we urge you to avoid placing undue reliance on forward-looking statements.
The S&P 500 Composite Index (“Index”) is a product of S&P Dow Jones Indices LLC and/or its affiliates and has been licensed for use by Capital Group. Copyright © 2025 S&P Dow Jones Indices LLC, a division of S&P Global, and/or its affiliates. All rights reserved. Redistribution or reproduction in whole or in part are prohibited without written permission of S&P Dow Jones Indices LLC.
FTSE source: London Stock Exchange Group plc and its group undertakings (collectively, the "LSE Group"). © LSE Group 2025. FTSE Russell is a trading name of certain of the LSE Group companies. "FTSE®" is a trade mark of the relevant LSE Group companies and is used by any other LSE Group company under licence. All rights in the FTSE Russell indices or data vest in the relevant LSE Group company which owns the index or the data. Neither LSE Group nor its licensors accept any liability for any errors or omissions in the indices or data and no party may rely on any indices or data contained in this communication. No further distribution of data from the LSE Group is permitted without the relevant LSE Group company's express written consent. The LSE Group does not promote, sponsor or endorse the content of this communication. The index is unmanaged and cannot be invested in directly.
BLOOMBERG® is a trademark and service mark of Bloomberg Finance L.P. and its affiliates (collectively “Bloomberg”). Bloomberg or Bloomberg’s licensors own all proprietary rights in the Bloomberg Indices. Neither Bloomberg nor Bloomberg’s licensors approves or endorses this material, or guarantees the accuracy or completeness of any information herein, or makes any warranty, express or implied, as to the results to be obtained therefrom and, to the maximum extent allowed by law, neither shall have any liability or responsibility for injury or damages arising in connection therewith.
MSCI does not approve, review or produce reports published on this site, makes no express or implied warranties or representations and is not liable whatsoever for any data represented. You may not redistribute MSCI data or use it as a basis for other indices or investment products.
Capital believes the software and information from FactSet to be reliable. However, Capital cannot be responsible for inaccuracies, incomplete information or updating of the information furnished by FactSet. The information provided in this report is meant to give you an approximate account of the fund/manager's characteristics for the specified date. This information is not indicative of future Capital investment decisions and is not used as part of our investment decision-making process.
Indices are unmanaged and cannot be invested in directly. Returns represent past performance, are not a guarantee of future performance, and are not indicative of any specific investment.
All Capital Group trademarks are owned by The Capital Group Companies, Inc. or an affiliated company in Canada, the U.S. and other countries. All other company names mentioned are the property of their respective companies.
Capital Group funds are offered in Canada by Capital International Asset Management (Canada), Inc., part of Capital Group, a global investment management firm originating in Los Angeles, California in 1931. Capital Group manages equity assets through three investment groups. These groups make investment and proxy voting decisions independently. Fixed income investment professionals provide fixed income research and investment management across the Capital organization; however, for securities with equity characteristics, they act solely on behalf of one of the three equity investment groups.
The Capital Group funds offered on this website are available only to Canadian residents.