Inflation
 Diana Wagner
Back in 2011 Netflix raised prices in the U.S. by dividing its streaming subscriptions from its original DVD service. The announcement sparked an uproar that forced the company to issue an apology and hammered the stock price.
Today the world is in a very different place — and so is Netflix: The company is now a dominant streaming service and a megahit-making machine with more than 213 million subscribers worldwide. Its latest breakout, “Squid Game” — a Korean drama about children’s games played with deadly consequences — captivated some 142 million households, making it the most viewed show in Netflix history.
This rising popularity has empowered the company to boost its prices. It has increased subscription rates in the U.S. four times since 2014, a period of robust subscriber growth globally. This is an example of pricing power, the ability to increase prices without losing customers.
Pricing power can be an antidote for inflation
Pricing power, always a positive for companies that can sustain it, may be a crucial competitive advantage in the year ahead. Inflation has surfaced in the economy, and there are signs that it could linger in the coming months. The annual inflation rate in the U.S., as measured by the consumer price index, rose to 5.4% in September, its highest level in 13 years. Rising costs can erode a company’s profit margins and, ultimately, investor returns. But companies with clear, sustainable pricing power can protect their profit margins by passing those costs along to customers.
In some industries, there is greater potential for pricing power
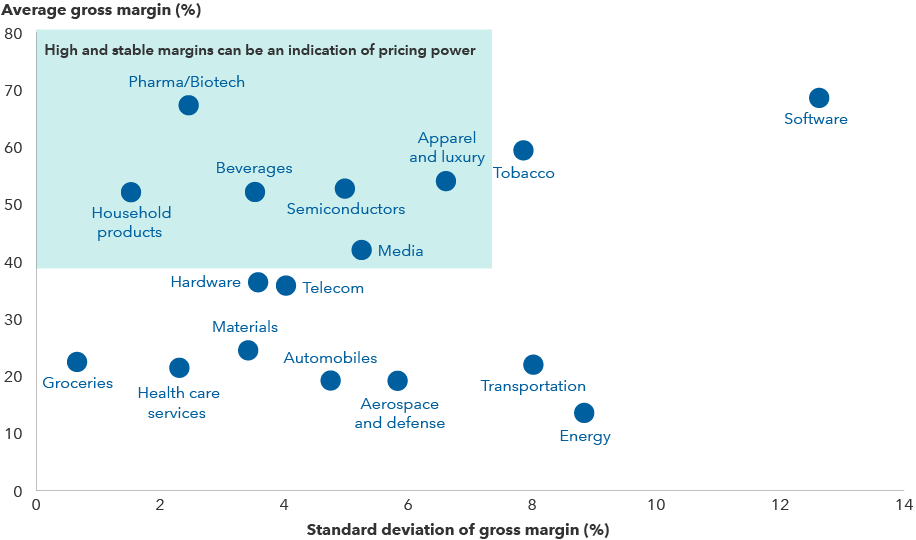
Sources: Capital Group, FactSet, MSCI. Reflects industries within MSCI World Index. Average and standard deviation of gross margins are calculated for the five-year period ended 9/30/21. Based in USD.
With growth slowing and inflation pressures building, as an equity portfolio manager I think it is essential to understand how companies with pricing power can offset inflation. Here is my perspective on pricing power.
Health care services: A prescription for inflation’s ills
High medical costs are a perennial hot button issue in Washington, and for good reason. Over the last 20 years, health care costs in the U.S. have risen at about 2.5 times the rate of broad inflation, as measured by the PCE inflation rate followed by the U.S. Federal Reserve.
Historically, U.S. health insurance companies have had pricing power and passed on rising health care costs to their customers through higher premiums. Today, companies like UnitedHealth Group are no longer mere toll collectors on the freeway of rising health care costs. They actually manage care.
Consider UnitedHealth Group, which is focused on helping governments and health care providers reduce spending and improve outcomes for patients. The company has been investing in predictive analytics and care delivery to reduce inefficiencies in the U.S. health care system.
They determined that the most powerful person in the care delivery ecosystem is the primary care doctor, who represents 3 cents of every dollar Americans spend on health care but determines where another 85 cents is spent. By getting primary care doctors involved earlier in decisions about care, UnitedHealth is seeking to keep members healthy and get more value for every dollar spent. By delivering more value, UnitedHealth can maintain its pricing power while helping to tackle a long-term problem in the United States.
Semiconductors: Everywhere, in everything
The story of pricing power in the semiconductor industry is simple: Soaring demand meets limited supply. Today semiconductors can be found not only in mobile phones and laptops but also in everyday household products like refrigerators and ovens. New cars can require as many as 100 chips. Indeed, the auto industry has felt the brunt of the global shortage in semiconductor supply.
The rollout of new technologies, like 5G, artificial intelligence and cloud computing have further fueled the world’s appetite for chips. In August, Taiwan Semiconductor Manufacturing disclosed that it would raise chip prices by as much as 20%.
Consolidation in the semiconductor industry has transformed the competitive landscape, leaving a few dominant players with potential pricing power in specialized areas of the market. For example, companies with proprietary chip designs, like Broadcom, or Dutch chip-component manufacturer ASML, could raise their prices in an inflationary environment.
Demand for semiconductors is soaring — along with pricing power
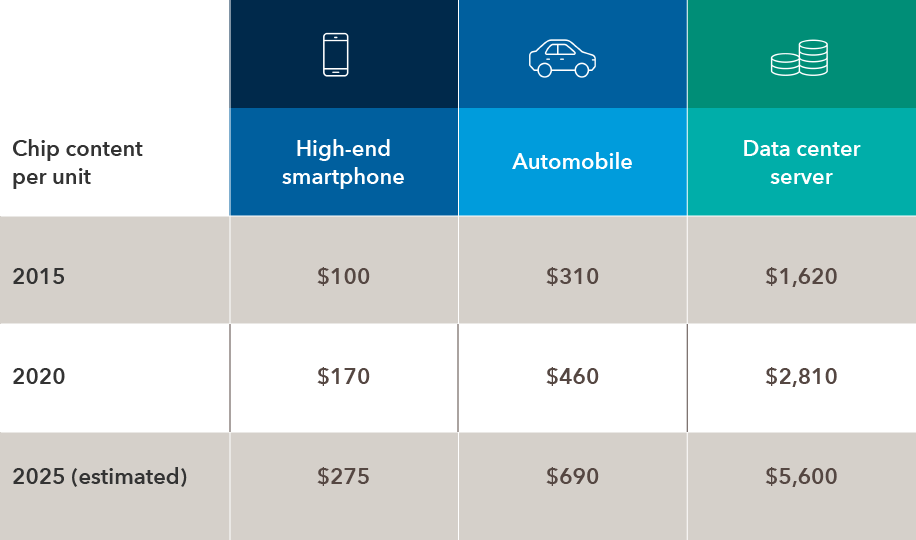
Sources: Applied Materials, Capital Group. Figures for 2025 are estimated. All figures are in USD.
Beverages: Thirsty for leading brands
The ability to raise prices without serious backlash not only varies across industries but also within them. In the food and beverage industry, drink companies tend to pass along higher costs to consumers better than many food companies. That’s because the beverage industry is dominated by a few players with strong brand recognition.
One example is Keurig Dr Pepper, the producer of sodas and single serving coffee pods. The company has a history of pricing power, particularly for its most popular soft drinks, which include Canada Dry, Snapple and, of course, Dr Pepper.
Video games: Not just child’s play
Once considered a minor niche in the entertainment industry, video games have soared in popularity and now represent the fastest growing segment of the world’s media entertainment industry. The global gaming industry is expected to grow to US$225 billion in annual revenue by 2025.
Manufacturers have recently been flexing their power to raise prices. With Microsoft and Sony introducing updates to their Xbox and PlayStation consoles, respectively, game makers have disclosed plans to raise prices on console games to help account for the cost of creating more sophisticated games.
A prime example of pricing power potential in the industry is the annual revenue from free-to-play games like Apex Legends from Electronic Arts and Fortnite, published by Epic Games. Tencent has a 40% ownership stake in Epic. Activision owns King, the publisher of popular mobile game Candy Crush. Free-to-play games generate revenue through advertising, whose rates can be increased as costs go up and through in-game purchases.
Believe it or not, players spend real money on virtual clothing, weapons and other supplies for their gaming characters. Essentially, industry leaders can set the price for such items as they please.
Revenue from free-to-play games, an area of pricing flexibility, has soared since 2011
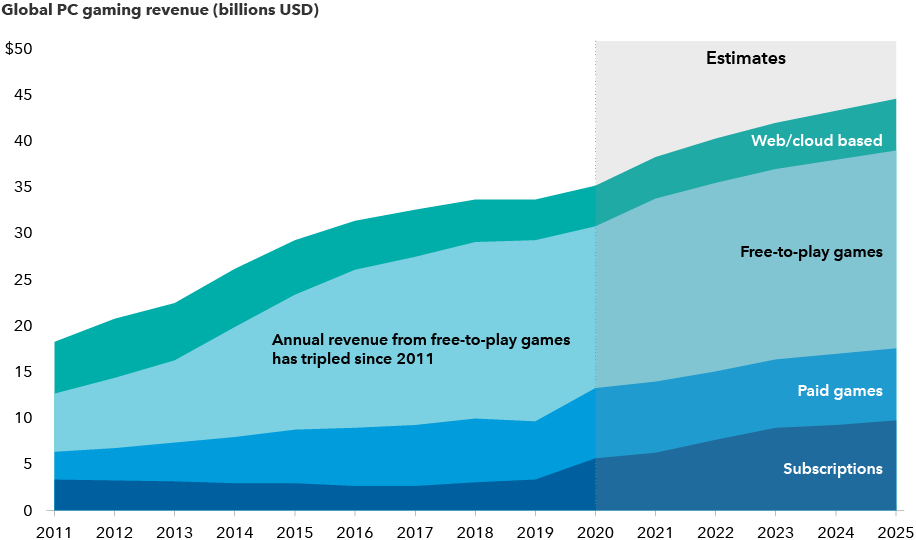
Sources: Capital Group, IDC (reports #US40181316 and #US47267621). 2021 through 2025 are estimates from IDC and do not reflect adjustments for inflation. Free-to-play game category includes microtransaction purchases and ad revenue.
The bottom line for investors: Focus on pricing power
I’m not ready to believe we are headed into a period of sustained inflation. But I do believe rising costs are likely to linger in the coming months, making it the biggest risk investors will face in 2022.
That’s why I am so focused on uncovering companies with pricing power.
I recently asked the investment analyst team that supports one of our U.S. mutual funds to find examples of pricing power in the industries they cover. They came up with dozens of ideas, ranging from companies in the defence industry to technology and the consumer staples sector.
With slowing growth, rising inflation and other uncertainties on the horizon, 2022 may seem a daunting environment for investors. But I’m optimistic that an active portfolio of select companies with strong pricing power can help investors thrive in the years ahead.
MSCI World Index is a free float-adjusted market capitalization-weighted index that is
designed to measure equity market results of developed markets. The index consists of more
than 20 developed market country indices, including the United States.
Our latest insights
-
-
Currencies
-
Market Volatility
-
Market Volatility
-
Markets & Economy
RELATED INSIGHTS
Commissions, trailing commissions, management fees and expenses all may be associated with investments in investment funds. Please read the prospectus before investing. Investment funds are not guaranteed or covered by the Canada Deposit Insurance Corporation or by any other government deposit insurer. For investment funds other than money market funds, their values change frequently. For money market funds, there can be no assurances that the fund will be able to maintain its net asset value per security at a constant amount or that the full amount of your investment in the fund will be returned to you. Past performance may not be repeated.
Unless otherwise indicated, the investment professionals featured do not manage Capital Group‘s Canadian investment funds.
References to particular companies or securities, if any, are included for informational or illustrative purposes only and should not be considered as an endorsement by Capital Group. Views expressed regarding a particular company, security, industry or market sector should not be considered an indication of trading intent of any investment funds or current holdings of any investment funds. These views should not be considered as investment advice nor should they be considered a recommendation to buy or sell.
Statements attributed to an individual represent the opinions of that individual as of the date published and do not necessarily reflect the opinions of Capital Group or its affiliates. This information is intended to highlight issues and not be comprehensive or to provide advice. For informational purposes only; not intended to provide tax, legal or financial advice. Capital Group funds are available in Canada through registered dealers. For more information, please consult your financial and tax advisors for your individual situation.
Forward-looking statements are not guarantees of future performance, and actual events and results could differ materially from those expressed or implied in any forward-looking statements made herein. We encourage you to consider these and other factors carefully before making any investment decisions and we urge you to avoid placing undue reliance on forward-looking statements.
The S&P 500 Composite Index (“Index”) is a product of S&P Dow Jones Indices LLC and/or its affiliates and has been licensed for use by Capital Group. Copyright © 2025 S&P Dow Jones Indices LLC, a division of S&P Global, and/or its affiliates. All rights reserved. Redistribution or reproduction in whole or in part are prohibited without written permission of S&P Dow Jones Indices LLC.
FTSE source: London Stock Exchange Group plc and its group undertakings (collectively, the "LSE Group"). © LSE Group 2025. FTSE Russell is a trading name of certain of the LSE Group companies. "FTSE®" is a trade mark of the relevant LSE Group companies and is used by any other LSE Group company under licence. All rights in the FTSE Russell indices or data vest in the relevant LSE Group company which owns the index or the data. Neither LSE Group nor its licensors accept any liability for any errors or omissions in the indices or data and no party may rely on any indices or data contained in this communication. No further distribution of data from the LSE Group is permitted without the relevant LSE Group company's express written consent. The LSE Group does not promote, sponsor or endorse the content of this communication. The index is unmanaged and cannot be invested in directly.
BLOOMBERG® is a trademark and service mark of Bloomberg Finance L.P. and its affiliates (collectively “Bloomberg”). Bloomberg or Bloomberg’s licensors own all proprietary rights in the Bloomberg Indices. Neither Bloomberg nor Bloomberg’s licensors approves or endorses this material, or guarantees the accuracy or completeness of any information herein, or makes any warranty, express or implied, as to the results to be obtained therefrom and, to the maximum extent allowed by law, neither shall have any liability or responsibility for injury or damages arising in connection therewith.
MSCI does not approve, review or produce reports published on this site, makes no express or implied warranties or representations and is not liable whatsoever for any data represented. You may not redistribute MSCI data or use it as a basis for other indices or investment products.
Capital believes the software and information from FactSet to be reliable. However, Capital cannot be responsible for inaccuracies, incomplete information or updating of the information furnished by FactSet. The information provided in this report is meant to give you an approximate account of the fund/manager's characteristics for the specified date. This information is not indicative of future Capital investment decisions and is not used as part of our investment decision-making process.
Indices are unmanaged and cannot be invested in directly. Returns represent past performance, are not a guarantee of future performance, and are not indicative of any specific investment.
All Capital Group trademarks are owned by The Capital Group Companies, Inc. or an affiliated company in Canada, the U.S. and other countries. All other company names mentioned are the property of their respective companies.
Capital Group funds are offered in Canada by Capital International Asset Management (Canada), Inc., part of Capital Group, a global investment management firm originating in Los Angeles, California in 1931. Capital Group manages equity assets through three investment groups. These groups make investment and proxy voting decisions independently. Fixed income investment professionals provide fixed income research and investment management across the Capital organization; however, for securities with equity characteristics, they act solely on behalf of one of the three equity investment groups.
The Capital Group funds offered on this website are available only to Canadian residents.