Market Volatility
If market declines make you nervous, you’re not alone. But while bear markets can be extraordinarily difficult, they also can be moments of opportunity. Investors who find the courage and conviction to stick to their long-term plans have often been rewarded as markets bounce back.
We hope this article can help you regain confidence by providing:
3 facts about market recoveries
Fact #1: Recoveries have been much longer and stronger than downturns
The good news is bear markets have been relatively short compared to recoveries. They can feel like they last forever when we’re in them, but in reality they have been much less impactful compared to the long-term power of bull markets.
Although every market decline is unique, the average bear market in the U.S. since 1950 has lasted 12 months. The average bull market has been more than five times longer.
The difference in returns has been just as dramatic. Even though the average bull market has averaged a 265% gain, recoveries are rarely a smooth ride. Investors often face scary headlines, significant market volatility and additional equity declines along the way. But investors able to move past the noise and stick to their plans have been better positioned when the recovery eventually occurs.
Every bull market has been longer than the bear market that preceded it

Sources: Capital Group, RIMES, Standard & Poor’s. Includes daily returns in the S&P 500 Index from 6/13/49–6/30/23. The bull market that began on 10/12/22 is considered current and is not included in the “average bull market” calculations. Bear markets are peak-to-trough price declines of 20% or more in the S&P 500. Bull markets are all other periods. Returns are in USD and are shown on a logarithmic scale. Past results are not predictive of results in future periods.
Fact #2: After large declines, markets have recovered relatively quickly
We don’t know exactly what the next recovery will look like, but historically stocks have often recovered sharply following steep downturns. We tracked the 18 biggest U.S. market declines since the Great Depression, and in each case the S&P 500 Index was higher five years later. Annual returns over those five-year periods averaged more than 18%.
Returns have often been strongest after the sharpest declines, bouncing back quickly from market bottoms. The first year following the five biggest bear markets since 1929 averaged 70.9%, underscoring the importance of staying invested and avoiding the urge to abandon stocks during market volatility. While these have been the average returns during these recoveries, each one has differed, and it‘s quite possible any future recovery could be more muted.
The worst bear markets were all followed by strong recoveries

Sources: Capital Group, RIMES, Standard & Poor’s. As of 6/30/23. Market declines are based on the five largest price return declines in the S&P 500’s value (excluding dividends and/or distributions) with 100% recovery after each decline. The return for each of the five years after a low is a 12-month return based on the date of the low and is shown in total returns (includes reinvested dividends and/or distributions). Investors cannot invest directly in an index. Past results are not predictive of results in future periods. Returns are in USD.
Fact #3: Some of the world’s leading companies were born during market recoveries
Many companies got their start during tough economic periods and have gone on to become household names.
To highlight just a few: McDonald’s emerged in 1948 following a downturn caused by the U.S. government’s demobilization from a wartime economy. Walmart came along 14 years later, around the time of the “Flash Crash of 1962” — a period when the S&P 500 Index declined 27%. Airbus, Microsoft and Starbucks were founded during the stagflation era of the 1970s — a decade marked by two recessions and one of the worst bear markets in U.S. history. Not long after, Steve Jobs walked into his garage and started a small computer company called Apple.
History has shown that strong businesses find a way to survive and even thrive when times are tough. Those that can adapt to difficult conditions and become stronger have often made attractive long-term investments.
Bottom-up, fundamental research is key to separating companies that may lead a market recovery, and those more likely to be left behind.
Many businesses got their start amid volatile markets
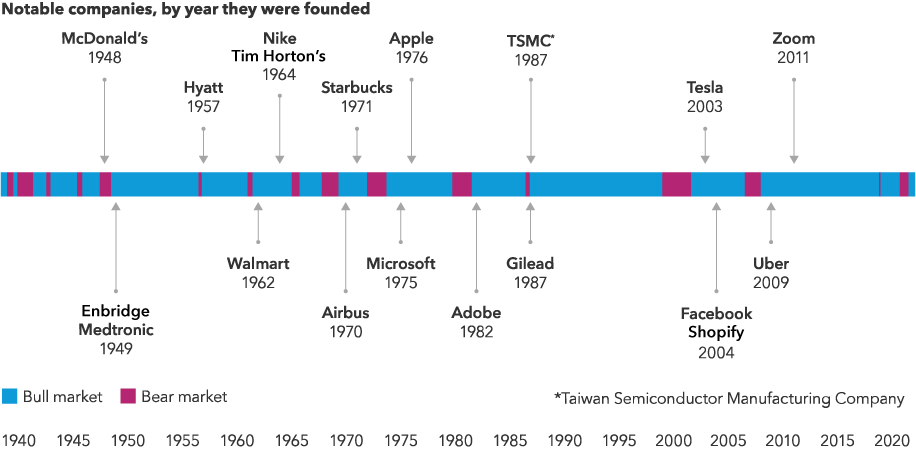
Source: Capital Group. As of 6/30/23. Bear markets are peak-to-trough price declines of 20% or more in the S&P 500. Bull markets are all other periods.
3 mistakes investors should avoid
Mistake #1: Trying to time markets
It’s time, not timing, that matters in investing. Taking your money out of the market on the way down means that if you don’t get back in at exactly the right time, you can’t capture the full benefit of any recovery.
Consider this example of a hypothetical US$10,000 investment in the S&P 500 Index made on July 1, 2013, and held for 10 years. Staying invested through the two bear markets during that period may have been tough, but this patient investor’s portfolio would have nearly tripled. If that investor had instead tried to time the market and missed even some of the best days, it would have significantly hurt their long-term results — and the more missed “good” days, the more missed opportunities.
Investors who are more hesitant to put all their excess capital to work at once may want to consider dollar cost averaging in volatile markets. Dollar cost averaging during a decline allows you to purchase more shares at a lower average cost, and when markets eventually rise, those extra shares can enhance your portfolio's value.
Missing just a few of the market’s best days can hurt investment returns

Sources: RIMES, Standard & Poor’s. As of 6/30/23. Values in USD and excludes the impact of dividends. Past results are not predictive of results in future periods.
Mistake #2: Assuming today’s negative headlines make it a bad time to invest
Today’s economic and geopolitical challenges may seem unprecedented, but a look through history shows that there have always been reasons not to invest. Despite negative headlines, the market’s long-term trend has always been positive. In fact, great investment opportunities often emerge when investors are feeling most pessimistic.
Consider a hypothetical investment in the S&P 500 on the day Pearl Harbor was bombed on December 7, 1941. Someone who stayed invested for the next 10 years would have averaged a 16% annual return. Likewise, a hypothetical US$10,000 investment in the S&P 500 on the day Lehman Brothers declared bankruptcy on September 15, 2008, would have grown to over US$30,000 10 years later. History has provided numerous examples of this.
Mistake #3: Focusing too much on the short term
Market volatility is especially uncomfortable when you focus on short-term ups and downs. Instead, extend your time horizon to focus on the long-term growth of your investments and the progress you’ve made toward your goals.
Consider the chart below that shows contrasting perspectives of the same hypothetical investment. The short-term view is one that many investors have of their portfolios — tracing returns over short periods of time. The long-term view plots the same exact investment over the same period but shows annual change in the portfolio value invested instead. With this perspective, the short-term fluctuations of the first chart have smoothed out over time, and the picture of a growing portfolio becomes clearer.
3 actions to consider in portfolios
Two views of the same investment tell a very different story

Sources: Standard & Poor’s. Short-term view represents the S&P 500 Index and reflects monthly total returns from 6/30/13 through 6/30/23. Long-term view represented by a hypothetical $10,000 initial investment in the same index from 6/30/13 through 6/30/23. Based in USD.
Action 1: Run a portfolio checkup
When markets are choppy, investors often shift assets from stocks and bonds into the perceived safe haven of cash and cash alternatives. With money market assets reaching a record level of US$5.4 trillion (as represented by Investment Company Institute Money Market Fund Assets as of June 30, 2023), many investors’ portfolios may have become misaligned with their long-term goals. To get back on track, investors may want to examine their portfolios to ensure they are well-diversified and in line with their investment objectives.
Capital Group can help. We offer financial professionals the opportunity to conduct an in-depth analysis with our team of portfolio consultants. And if you’re an investor, now may be a good time to talk to your financial professional about having a portfolio checkup.
Action 2: Upgrade your core bonds
A fixed income allocation may help to soften short-term market noise during periods of volatility and help investors remain focused on longer term goals. When evaluating your bond portfolio, consider these three steps:
- Upgrade your core: A core bond allocation can provide resilience amid equity uncertainty, while active, research-driven investing seeks to add potential upside when equities recover.
- Selectively pursue enhanced income: When stocks thrive, credit often does too. But consider a flexible, income-driven bond fund that can adjust based on shifting market conditions.
- Consider short-term bonds: Following a deep market correction, pivoting from the ultra-safe nature of cash may be daunting. Short-term bonds offer anxious investors an allocation which seeks to keep capital preservation in mind with stronger income potential than cash alternatives.
Action 3: Expand your horizons
In uncertain times, it can be natural to narrow your perspective and focus where you’re most comfortable. But if you can broaden your horizons, you may be able to benefit from the growth potential of companies in a variety of industries and markets.
And even if you think markets have bottomed and are poised for a strong recovery, don’t assume all the best stocks will come from either the United States or Canada. Over the last prolonged bull market, the S&P 500 Index soundly outpaced many of its international peer indicies, but three quarters of the top-returning stocks each year were from companies based abroad.
Investors seeking additional global or international exposure may want to consider funds with flexible mandates that allow their managers to choose from the best companies, no matter where they are located.
Most of the top stocks each year have come from outside the U.S.
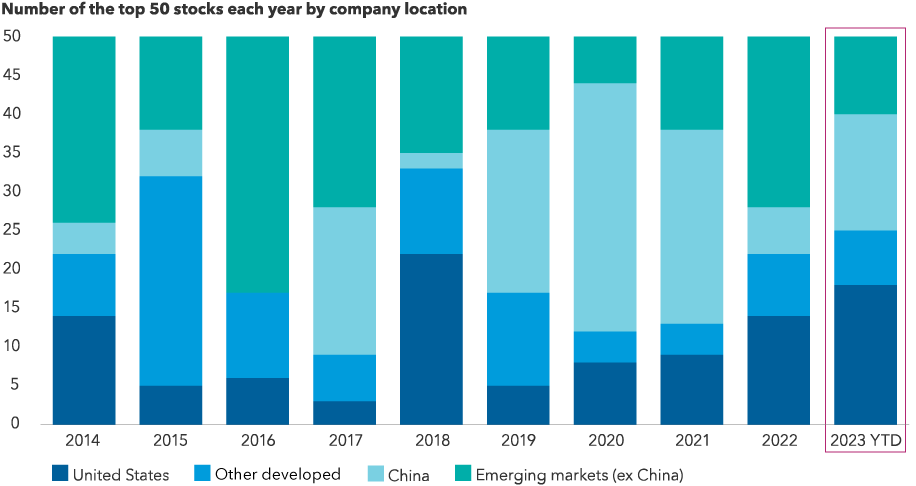
Sources: MSCI, RIMES. 2023 data as of 6/30/23. Returns in USD. Top 50 stocks are the companies with the highest total returns in the MSCI ACWI each year. “Other developed” includes Canada (of the top 50 stocks in the ACWI, one company was based in Canada).
MSCI All Country World Index (ACWI) is a free float-adjusted, market capitalization-weighted index that is designed to measure equity market results in the global developed and emerging markets, consisting of more than 40 developed and emerging market country indexes.
S&P 500 Index is a market capitalization-weighted index based on the results of approximately 500 widely held common stocks.
Our latest insights
-
-
Currencies
-
Market Volatility
-
Market Volatility
-
Markets & Economy
RELATED INSIGHTS
-
Chart in Focus
-
Chart in Focus
-
Commissions, trailing commissions, management fees and expenses all may be associated with investments in investment funds. Please read the prospectus before investing. Investment funds are not guaranteed or covered by the Canada Deposit Insurance Corporation or by any other government deposit insurer. For investment funds other than money market funds, their values change frequently. For money market funds, there can be no assurances that the fund will be able to maintain its net asset value per security at a constant amount or that the full amount of your investment in the fund will be returned to you. Past performance may not be repeated.
Unless otherwise indicated, the investment professionals featured do not manage Capital Group‘s Canadian investment funds.
References to particular companies or securities, if any, are included for informational or illustrative purposes only and should not be considered as an endorsement by Capital Group. Views expressed regarding a particular company, security, industry or market sector should not be considered an indication of trading intent of any investment funds or current holdings of any investment funds. These views should not be considered as investment advice nor should they be considered a recommendation to buy or sell.
Statements attributed to an individual represent the opinions of that individual as of the date published and do not necessarily reflect the opinions of Capital Group or its affiliates. This information is intended to highlight issues and not be comprehensive or to provide advice. For informational purposes only; not intended to provide tax, legal or financial advice. Capital Group funds are available in Canada through registered dealers. For more information, please consult your financial and tax advisors for your individual situation.
Forward-looking statements are not guarantees of future performance, and actual events and results could differ materially from those expressed or implied in any forward-looking statements made herein. We encourage you to consider these and other factors carefully before making any investment decisions and we urge you to avoid placing undue reliance on forward-looking statements.
The S&P 500 Composite Index (“Index”) is a product of S&P Dow Jones Indices LLC and/or its affiliates and has been licensed for use by Capital Group. Copyright © 2025 S&P Dow Jones Indices LLC, a division of S&P Global, and/or its affiliates. All rights reserved. Redistribution or reproduction in whole or in part are prohibited without written permission of S&P Dow Jones Indices LLC.
FTSE source: London Stock Exchange Group plc and its group undertakings (collectively, the "LSE Group"). © LSE Group 2025. FTSE Russell is a trading name of certain of the LSE Group companies. "FTSE®" is a trade mark of the relevant LSE Group companies and is used by any other LSE Group company under licence. All rights in the FTSE Russell indices or data vest in the relevant LSE Group company which owns the index or the data. Neither LSE Group nor its licensors accept any liability for any errors or omissions in the indices or data and no party may rely on any indices or data contained in this communication. No further distribution of data from the LSE Group is permitted without the relevant LSE Group company's express written consent. The LSE Group does not promote, sponsor or endorse the content of this communication. The index is unmanaged and cannot be invested in directly.
BLOOMBERG® is a trademark and service mark of Bloomberg Finance L.P. and its affiliates (collectively “Bloomberg”). Bloomberg or Bloomberg’s licensors own all proprietary rights in the Bloomberg Indices. Neither Bloomberg nor Bloomberg’s licensors approves or endorses this material, or guarantees the accuracy or completeness of any information herein, or makes any warranty, express or implied, as to the results to be obtained therefrom and, to the maximum extent allowed by law, neither shall have any liability or responsibility for injury or damages arising in connection therewith.
MSCI does not approve, review or produce reports published on this site, makes no express or implied warranties or representations and is not liable whatsoever for any data represented. You may not redistribute MSCI data or use it as a basis for other indices or investment products.
Capital believes the software and information from FactSet to be reliable. However, Capital cannot be responsible for inaccuracies, incomplete information or updating of the information furnished by FactSet. The information provided in this report is meant to give you an approximate account of the fund/manager's characteristics for the specified date. This information is not indicative of future Capital investment decisions and is not used as part of our investment decision-making process.
Indices are unmanaged and cannot be invested in directly. Returns represent past performance, are not a guarantee of future performance, and are not indicative of any specific investment.
All Capital Group trademarks are owned by The Capital Group Companies, Inc. or an affiliated company in Canada, the U.S. and other countries. All other company names mentioned are the property of their respective companies.
Capital Group funds are offered in Canada by Capital International Asset Management (Canada), Inc., part of Capital Group, a global investment management firm originating in Los Angeles, California in 1931. Capital Group manages equity assets through three investment groups. These groups make investment and proxy voting decisions independently. Fixed income investment professionals provide fixed income research and investment management across the Capital organization; however, for securities with equity characteristics, they act solely on behalf of one of the three equity investment groups.
The Capital Group funds offered on this website are available only to Canadian residents.