Market Volatility
Categories
Fed
Fed’s aggressive path could mean more market turmoil
 Darrell Spence
 Damien McCann
 Timothy Ng
 Wesley Phoa
June 16, 2022
With a 75-basis point (bps) rate hike, the biggest single move in nearly three decades, the U.S. Federal Reserve has signaled that bringing down inflation is its primary focus. The Fed moved to a more aggressive policy stance following a firmer-than-expected May U.S. consumer price index (CPI) report, which showed an 8.6% increase, driven by broad-based price pressures.
With little indication that these pressures have peaked, and a greater risk that inflation will spiral out of control, the Fed is likely to maintain an aggressive posture unless financial conditions tighten sharply.
“Clearly today’s 75 bps increase is an unusually large one, and I do not expect moves of this size to be common. From the perspective of today, either a 50 bps or a 75 bps increase seems most likely at our next meeting,” Fed Chair Jerome Powell said following the June 15 decision. The Fed’s new “dot plot,” which shows the Fed governors’ individual inflation projections, is now signaling that the federal funds rate could be 3.4% by the end of the year. The U.S. market appeared to pare back expectations on the pace of rate hikes as a result, and stocks rose immediately after the Fed’s announcement.
Notwithstanding the 75 bps rise, which brings the federal funds rate target to a range of 1.50%-1.75%, the May CPI report left little doubt that inflation is moving higher and remains the Fed’s main concern. The Fed’s latest policy statement said the committee “is strongly committed to returning inflation to its 2% objective,” while Powell said they were “acutely” attuned to inflation risks.
We’re seeing strong contributions to monthly core CPI from both goods and services, although retail spending declined in May, which could suggest demand is starting to cool. Approximately 20% of the sectors in the core CPI basket are experiencing inflation at or below the Fed’s target of 2%, compared to around 55% before the COVID-19 pandemic. Meanwhile, owners’ equivalent rent (24% of the CPI basket) is moving decisively higher, a trend that will likely persist in the coming months.
U.S. inflationary pressures are broad-based
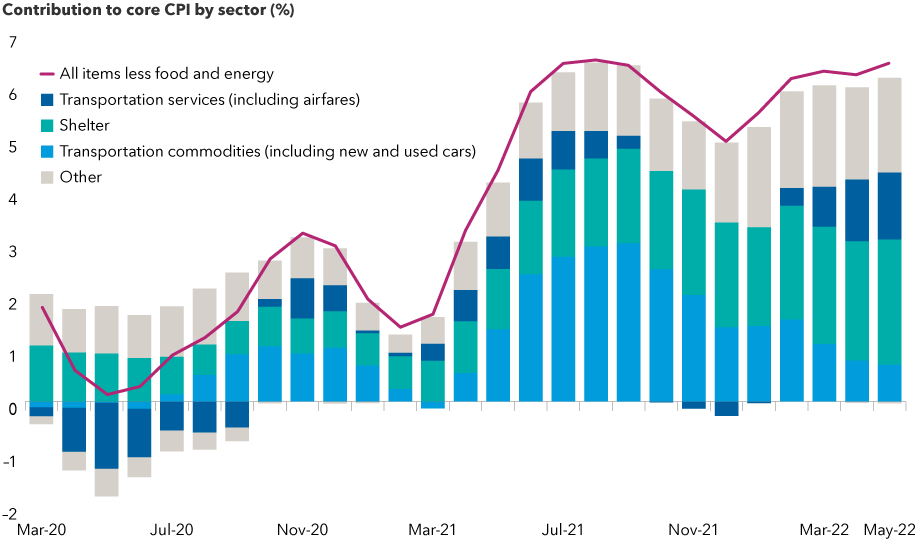
Chart Source: U.S. Bureau of Labor Statistics. CPI = U.S. consumer price index. Core CPI refers to all items in the consumer price index excluding food and energy. “Other” comprises all categories in the core CPI excluding transportation services, shelter and transportation commodities. Data as of June 10, 2022. Based in USD.
The central bank’s job is made that much more difficult because the labour market is extremely tight. Recent academic and private-sector research shows that it may be even tighter than the official data suggests because of the decline in the labour force participation rate. Below, we provide perspectives from U.S. economist Darrell Spence, fixed income portfolio managers Tim Ng and Damien McCann, and solutions portfolio manager Wesley Phoa.
Stocks remain vulnerable amid rising rates and recession risk
Darrell Spence, U.S. economist
We are starting to see a moderate wage-price spiral developing in the United States, and as I look at the landscape, it is hard to see a clear path to bring inflation back to the Fed’s 2% target without putting the economy into a recession. Given its inability to fix supply side bottlenecks, lower growth and rising unemployment is what the Fed has to achieve if it wants to actually get inflation down.
The only way to really break the wage-price spiral, in my view, is to create a lot of slack in the labour market, which is done by pushing the unemployment rate up. As such, the unemployment rate may need to rise by 2 percentage points, or even more, before wage growth starts to moderate. Despite the current strength we are seeing in consumer and corporate balance sheets, I believe this will make a recession very difficult to avoid in 2023.
The S&P 500 Index entered bear market territory on June 13 (closing 20% below its most recent high), but I see little reason to believe market turmoil will cause the Fed to back off its plan. I think it will take a clear and significant deceleration of inflation for the Fed to stop hiking.
Core CPI is currently around 6%, and the Fed’s target is 2%, suggesting a 4-percentage-point decline in core CPI is needed. This is nearly as large as the 5-percentage-point decline that occurred in the early 1980s (once one adjusts the historical CPI data for methodological changes that have occurred since then). Achieving that amount of disinflation ultimately required a real federal funds rate in excess of 5%.
Currently, the market expects the federal funds rate to peak around 4% in mid-2023, which would most likely still leave the real federal funds rate in negative territory. No tightening cycle has ended with the real federal funds rate still in negative territory. Granted, many things about the economy are different from what they were during earlier tightening cycles, but this does suggest the Fed may have to raise rates by more than the market currently expects.
What does this mean for markets and earnings?
A more challenging economic environment will likely pressure corporate earnings as we head into 2023. While the silver lining to inflation is that it can provide a boost to earnings growth, that is usually a short-lived phenomenon and eventually outweighed by the decline in activity that inflation — and the associated policy response — can generate. I still expect earnings per share (EPS) for companies in the S&P 500 to grow around 7% in 2022. However, I now expect a nearly 10% decline in 2023. This puts the market price-earnings multiple at 18.7x for 2023. This is still a bit high for the interest rate environment I envision, and there is also a chance that the earnings forecast gets revised down even further.
The bottom line is that bear markets associated with a recession have tended to be deeper and longer. History shows that such bear markets (in this case defined by a 15% market decline threshold) experienced a median percentage decline of 33.9% over a median duration of 17 months. Thus, we may continue to experience market volatility, and could potentially see another leg down before we reach a market bottom.
Fed likely to stick with tightening path
Tim Ng, portfolio manager, Capital Group Canadian Core Plus Fixed Income FundTM (Canada)
We are seeing a significant inversion in the front end of the yield curve with interest rate futures showing the fed funds rate peaking at 4% by the middle of 2023 but approximately 50 basis points of cuts thereafter. This makes sense as the market continues to pull rate hikes forward.
While I continue to think inflationary pressures will stay elevated and the Fed will need to tighten further, I also think the central bank will be mindful of the potential impact on markets and the tightening of financial conditions. Even though the Fed is laser-focused on inflation and has demonstrated a high tolerance for declining asset prices, it will not ignore the need for market stability.
With the market already pricing 4% peak funds and 200 bps of hikes over the next three meetings, the risk/reward of staying short duration is becoming less attractive. Duration is a measure of a bond’s price to interest rate changes. Keeping duration and curve exposures closer to neutral makes sense as we approach what I think will likely be a volatile period in markets for the remainder of the year.
Stay selective in credit markets
Damien McCann, portfolio manager, Capital Group Multi-Sector Income FundTM (Canada)
The next few quarters will likely continue to be bumpy for fixed income spread assets. While valuations have cheapened across fixed income sectors, I think it still may be early to go overweight in the riskier areas of the market, such as high yield. Now is a time to think about protecting a portfolio by investing in parts of the market that are more attractively valued, and relying on research and active management to help get through this period with as little damage as possible. Within credit, on a relative basis, we are finding greater value in securitized credit and select areas of emerging markets debt. These markets have priced a lot of the geopolitical risk from the Russia-Ukraine war. And in many cases, emerging markets central banks are ahead of their developed-market counterparts in the fight on inflation.
Favouring a defensive posture in riskier asset classes
Wesley Phoa, portfolio manager, Capital Group Monthly Income PortfolioTM (Canada)
With its more aggressive stance, the Fed continues to regain credibility. But markets will remain volatile and risk assets will stay under pressure. We’ve had a long period of very low rates when so-called long-duration stocks did really well. If these growth stocks had good long-term prospects, it did not matter that they were burning cash. That dynamic has reversed as the discount rate on stocks has gone up with the spike in yields.
At the same time, there is a lot less liquidity in the markets as quantitative easing shifts to quantitative tightening. With lower liquidity, investors are not as willing to fund companies burning cash today for growth tomorrow. As a result, in addition to equities, many riskier asset classes have come under selling pressure, including private credit, private equity, crypto currencies and financing for mergers-and-acquisitions (M&A) activity.
Many Capital Group portfolio managers have sought to reduce their risk exposure by moving investments to areas of growth that traditionally have stronger cash flows, to less cyclical industries and, where appropriate by mandate, to dividend-oriented stocks.
Stock valuations have also ratcheted down as profit margins are compressed by higher input costs. Improved labour bargaining power results in higher labour costs for companies. And heightened supply chain risk is forcing companies to move away from just-in-time inventories and build redundancies.
That said, the negative factors today are easier to see. The trends are more apparent and, hence, getting priced in quickly by markets. But for the longer term, I view it as a positive development that labour has structurally more bargaining power. It’s better for households, and what’s good for consumers is good for the economy in the long term. I expect solid, long-term innovation-driven investment themes, and companies will survive and thrive as investors distinguish the wheat from the chaff.
Learn more about
The S&P 500 Index is a market capitalization-weighted index based on the results of approximately 500 widely held common U.S. large cap stocks.
Our latest insights
-
-
Market Volatility
-
-
Currencies
-
Market Volatility
RELATED INSIGHTS
-
U.S. Equities
-
-
Market Volatility
Commissions, trailing commissions, management fees and expenses all may be associated with investments in investment funds. Please read the prospectus before investing. Investment funds are not guaranteed or covered by the Canada Deposit Insurance Corporation or by any other government deposit insurer. For investment funds other than money market funds, their values change frequently. For money market funds, there can be no assurances that the fund will be able to maintain its net asset value per security at a constant amount or that the full amount of your investment in the fund will be returned to you. Past performance may not be repeated.
Unless otherwise indicated, the investment professionals featured do not manage Capital Group‘s Canadian investment funds.
References to particular companies or securities, if any, are included for informational or illustrative purposes only and should not be considered as an endorsement by Capital Group. Views expressed regarding a particular company, security, industry or market sector should not be considered an indication of trading intent of any investment funds or current holdings of any investment funds. These views should not be considered as investment advice nor should they be considered a recommendation to buy or sell.
Statements attributed to an individual represent the opinions of that individual as of the date published and do not necessarily reflect the opinions of Capital Group or its affiliates. This information is intended to highlight issues and not be comprehensive or to provide advice. For informational purposes only; not intended to provide tax, legal or financial advice. Capital Group funds are available in Canada through registered dealers. For more information, please consult your financial and tax advisors for your individual situation.
Forward-looking statements are not guarantees of future performance, and actual events and results could differ materially from those expressed or implied in any forward-looking statements made herein. We encourage you to consider these and other factors carefully before making any investment decisions and we urge you to avoid placing undue reliance on forward-looking statements.
The S&P 500 Composite Index (“Index”) is a product of S&P Dow Jones Indices LLC and/or its affiliates and has been licensed for use by Capital Group. Copyright © 2026 S&P Dow Jones Indices LLC, a division of S&P Global, and/or its affiliates. All rights reserved. Redistribution or reproduction in whole or in part are prohibited without written permission of S&P Dow Jones Indices LLC.
FTSE source: London Stock Exchange Group plc and its group undertakings (collectively, the "LSE Group"). © LSE Group 2026. FTSE Russell is a trading name of certain of the LSE Group companies. "FTSE®" is a trade mark of the relevant LSE Group companies and is used by any other LSE Group company under licence. All rights in the FTSE Russell indices or data vest in the relevant LSE Group company which owns the index or the data. Neither LSE Group nor its licensors accept any liability for any errors or omissions in the indices or data and no party may rely on any indices or data contained in this communication. No further distribution of data from the LSE Group is permitted without the relevant LSE Group company's express written consent. The LSE Group does not promote, sponsor or endorse the content of this communication. The index is unmanaged and cannot be invested in directly.
BLOOMBERG® is a trademark and service mark of Bloomberg Finance L.P. and its affiliates (collectively “Bloomberg”). Bloomberg or Bloomberg’s licensors own all proprietary rights in the Bloomberg Indices. Neither Bloomberg nor Bloomberg’s licensors approves or endorses this material, or guarantees the accuracy or completeness of any information herein, or makes any warranty, express or implied, as to the results to be obtained therefrom and, to the maximum extent allowed by law, neither shall have any liability or responsibility for injury or damages arising in connection therewith.
The MSCI information may only be used for your internal use, may not be reproduced or redisseminated in any form and may not be used as a basis for or a component of any financial instruments or products or indices. None of the MSCI information is intended to constitute investment advice or a recommendation to make (or refrain from making) any kind of investment decision and may not be relied on as such. Historical data and analysis should not be taken as an indication or guarantee of any future performance analysis, forecast or prediction. The MSCI information is provided on an “as is” basis and the user of this information assumes the entire risk of any use made of this information. MSCI, each of its affiliates and each other person involved in or related to compiling, computing or creating any MSCI information (collectively, the “MSCI Parties”) expressly disclaims all warranties (including, without limitation, any warranties of originality, accuracy, completeness, timeliness, non-infringement, merchantability and fitness for a particular purpose) with respect to this information. Without limiting any of the foregoing, in no event shall any MSCI Party have any liability for any direct, indirect, special, incidental, punitive, consequential (including, without limitation, lost profits) or any other damages. (www.msci.com)
Capital believes the software and information from FactSet to be reliable. However, Capital cannot be responsible for inaccuracies, incomplete information or updating of the information furnished by FactSet. The information provided in this report is meant to give you an approximate account of the fund/manager's characteristics for the specified date. This information is not indicative of future Capital investment decisions and is not used as part of our investment decision-making process.
Indices are unmanaged and cannot be invested in directly. Returns represent past performance, are not a guarantee of future performance, and are not indicative of any specific investment.
All Capital Group trademarks are owned by The Capital Group Companies, Inc. or an affiliated company in Canada, the U.S. and other countries. All other company names mentioned are the property of their respective companies.
Capital Group funds are offered in Canada by Capital International Asset Management (Canada), Inc., part of Capital Group, a global investment management firm originating in Los Angeles, California in 1931. Capital Group manages equity assets through three investment groups. These groups make investment and proxy voting decisions independently. Fixed income investment professionals provide fixed income research and investment management across the Capital organization; however, for securities with equity characteristics, they act solely on behalf of one of the three equity investment groups.
The Capital Group funds offered on this website are available only to Canadian residents.