Interest Rates
 David Hoag
 Darrell Spence
 Diana Wagner
With interest rates trending downward for more than 40 years, investors enjoyed a powerful tailwind driving one of the greatest bull markets in history. But what happens when rates suddenly start moving up as inflation soars to levels not seen since the 1980s? We’re about to find out.
Now that the U.S. Federal Reserve, the Bank of Canada and many other central banks around the world have committed to hiking rates and cutting stimulus measures, investors face an important question: Is the era of easy money coming to an end? As usual in the financial markets, the answer isn’t a simple yes or no.
“It's probably the end of free money, but I don't think it's the end of easy money,” says David Hoag, a keen Fed watcher and a portfolio manager for Capital Group Capital Income BuilderTM (Canada).
“Central banks will do what they need to do to get inflation under control, but I don’t think they will be able to go too far before the real economy starts hurting.”
Free fall: U.S. interest rates have plummeted in the era of easy money
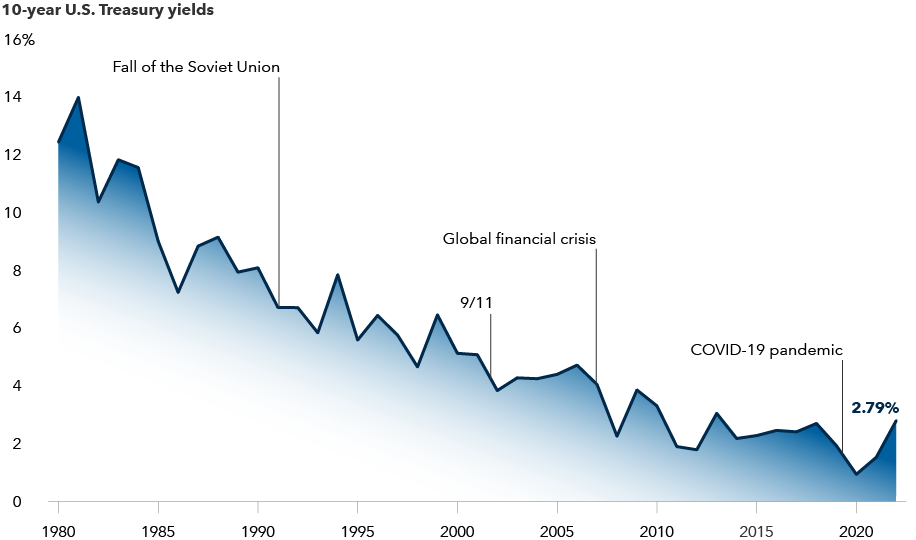
Sources: Federal Reserve, Refinitiv Datastream. As of 4/11/22.
The Fed, for instance, isn’t likely to raise the federal funds target rate anywhere near the long-term historical average of just under 5.0%, Hoag notes. The Fed’s key policy rate — which guides overnight lending among U.S. banks and influences many other forms of borrowing — currently sits in a range between 0.25% and 0.50% following last month’s rate hike.
Hoag thinks the Fed will stop hiking somewhere around 2.0%. “That’s a significant increase from where we are today,” he acknowledges, “but it’s still very low on a historical basis. Anything higher than that, in my view, risks pushing the U.S. into a recession.”
At the moment, market expectations are higher, thanks to hawkish comments from Fed officials over the past few weeks. The futures market is pricing in a rate of 3.0% by March 2023, including a 50 basis point hike at the Fed’s next two-day meeting beginning May 3.
Fed rate hike expectations have risen dramatically
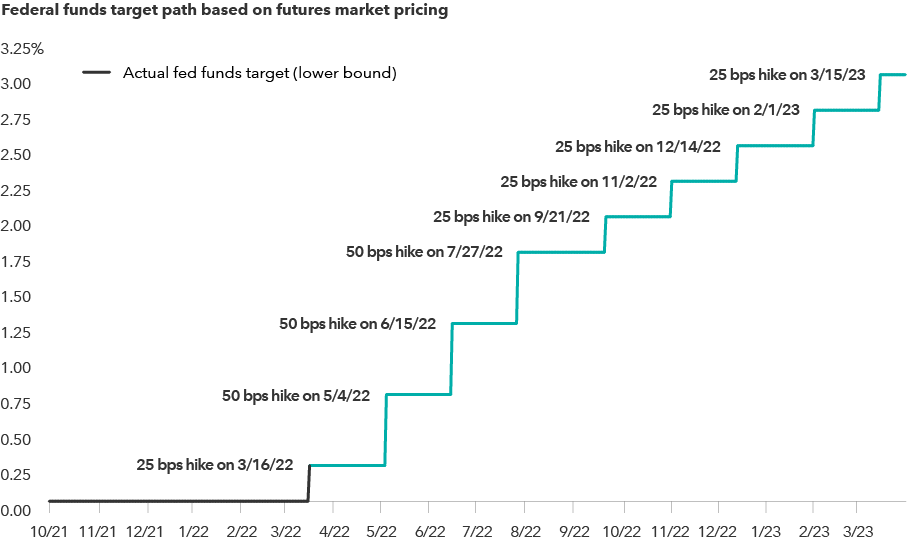
Sources: Capital Group, Chicago Mercantile Exchange. Federal funds target path based on probability analysis of fed fund futures contract prices as calculated by the Chicago Mercantile Exchange. As of April 14, 2022.
Over the past 14 years, the Fed has taken the previously unprecedented step of slashing its key policy rate to near zero — first as a reaction to the 2007–2009 global financial crisis and then to help support the U.S. economy during the COVID-19 crisis. Massive bond-buying stimulus programs also served to keep longer term interest rates artificially low.
“You can’t keep money at zero interest rates forever,” says Capital Group economist Darrell Spence. “We are seeing the end of this current period of zero rates and balance sheet expansion, but I’m not convinced that we won’t be back here again.”
Pushing the “easy button”
The Fed, European Central Bank and other central banks have found the “easy button” when it comes to addressing periods of severe financial crisis, Spence explains, and it would be naïve to think they won’t use it when the next crisis comes along.
“I’m sure history will look back at this period and find many reasons to argue that it was a bad idea,” he adds. “But, in the moment, it’s difficult to say what else we could have done or what we might do differently in the future. When you let the genie out of the bottle on this type of monetary policy, it’s hard to put it back in.”
In the meantime, investors should brace for further volatility as high inflation, tighter monetary policy and the war in Ukraine continue to disrupt markets. Recession risk is higher in Europe, Spence says, because of its closer proximity to the war and dependence on Russian energy, but the U.S. economy is also slowing under the weight of broken supply chains and higher consumer prices.
Spence doesn’t think a U.S. recession is imminent, but he puts the chance of an economic downturn at 25% to 30% by 2023, particularly if the Fed follows through with a full complement of rate hikes between now and then.
What does an environment of low growth and rising rates mean for investing?
Consider building an “all weather” portfolio
Despite investor fears of tighter monetary policy, U.S. stocks and bonds have powered through previous periods of rising interest rates. During 10 such periods since 1964, the S&P 500 has posted an average return of 7.7% in U.S. dollars. Bonds have also held up well, with the Bloomberg Barclays U.S. Aggregate Index returning an average of 3.9% during seven rate hiking cycles dating back to 1983.
The initial adjustment period can be tough, as we saw in the first quarter of this year, with the S&P 500 down 4.6%. Bonds suffered their worst quarter in 20 years, with a 5.9% decline. But over longer time periods, markets have tended to adjust, and bond investors in particular have benefited from the opportunity to reinvest at higher yields.
U.S. stocks generally have done well during past rising rate periods
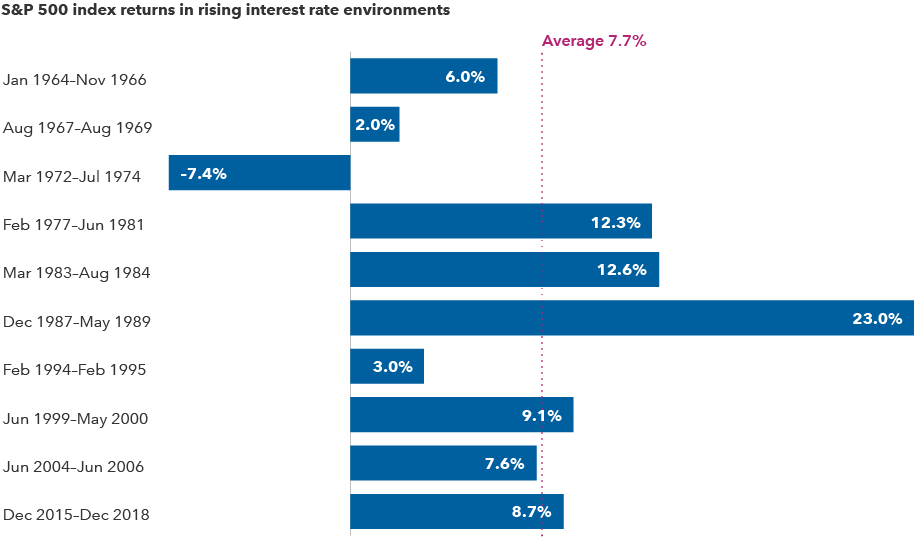
Sources: Capital Group, Refinitiv Datastream, Standard & Poor's, U.S. Federal Reserve. S&P 500 returns represent annualized total returns. Returns are in USD.
Of course, this data comes with the usual caveat that past results are not predictive of future returns. And, in fact, we’ve never experienced a period where central banks are unwinding massive balance sheets — much larger than they were following the global financial crisis — while raising interest rates from zero (or even negative territory in the case of the ECB). A lot can go wrong.
Such uncertainty makes building an “all weather” portfolio all the more important, says equity portfolio manager Diana Wagner.
For active investors, the key to navigating difficult periods is finding attractively valued companies that can generate earnings and profit growth regardless of the economic environment, Wagner explains.
“In this environment, there's going to be less tolerance for business models that can’t demonstrate a path to profitability in some reasonable time frame,” she says. That’s in contrast to last year when unprofitable tech companies rallied.
That doesn’t mean tech stocks can’t do well. In fact, the information technology sector has generated solid returns during the last four periods of rising rates. But it’s important to be selective.
Which sectors have performed best when interest rates rise?
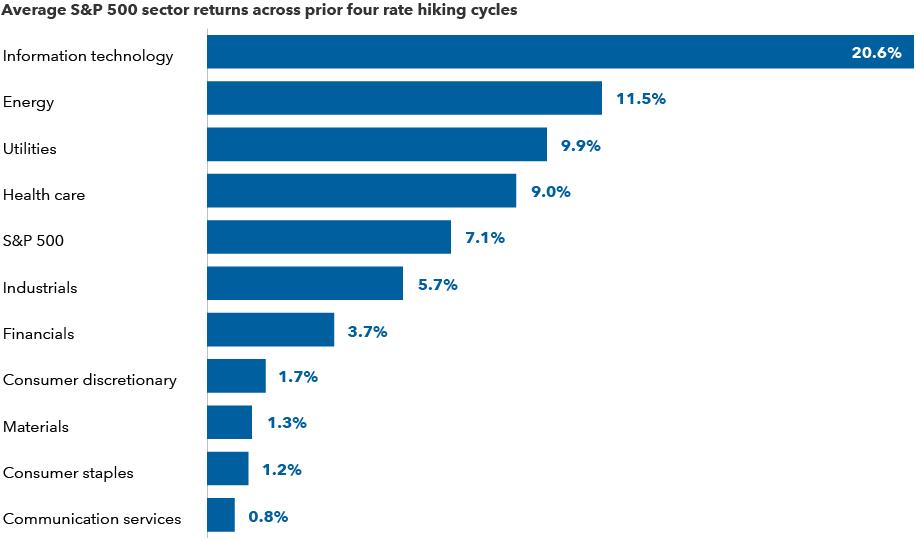
Sources: Capital Group, Refinitiv Datastream, S&P 500. Rate hike reference periods include February 1994–February 1995, June 1999–May 2000, June 2004–June 2006, and December 2015–December 2018. Average return calculations are based on annualized total returns. Returns are in USD.
Wagner cites Microsoft, UnitedHealth and Marsh & McLennan as examples that have exhibited “all weather” capabilities in the past.
“In a market where growth may be scarce,” she adds, “I prefer companies that have a demonstrated track record of making their own growth happen — companies with high return on equity, low commodity input costs and strong pricing power.”
Moreover, valuations are paramount.
“I think the era of not paying attention to valuations is gone,” Wagner says.
S&P 500 is a market capitalization-weighted index based on the results of approximately 500 widely held common stocks.
Bloomberg Barclays U.S. Aggregate Index represents the U.S. investment-grade fixed-rate bond market.
Our latest insights
-
-
Currencies
-
Market Volatility
-
Market Volatility
-
Markets & Economy
RELATED INSIGHTS
-
Market Volatility
-
Market Volatility
-
Commissions, trailing commissions, management fees and expenses all may be associated with investments in investment funds. Please read the prospectus before investing. Investment funds are not guaranteed or covered by the Canada Deposit Insurance Corporation or by any other government deposit insurer. For investment funds other than money market funds, their values change frequently. For money market funds, there can be no assurances that the fund will be able to maintain its net asset value per security at a constant amount or that the full amount of your investment in the fund will be returned to you. Past performance may not be repeated.
Unless otherwise indicated, the investment professionals featured do not manage Capital Group‘s Canadian investment funds.
References to particular companies or securities, if any, are included for informational or illustrative purposes only and should not be considered as an endorsement by Capital Group. Views expressed regarding a particular company, security, industry or market sector should not be considered an indication of trading intent of any investment funds or current holdings of any investment funds. These views should not be considered as investment advice nor should they be considered a recommendation to buy or sell.
Statements attributed to an individual represent the opinions of that individual as of the date published and do not necessarily reflect the opinions of Capital Group or its affiliates. This information is intended to highlight issues and not be comprehensive or to provide advice. For informational purposes only; not intended to provide tax, legal or financial advice. Capital Group funds are available in Canada through registered dealers. For more information, please consult your financial and tax advisors for your individual situation.
Forward-looking statements are not guarantees of future performance, and actual events and results could differ materially from those expressed or implied in any forward-looking statements made herein. We encourage you to consider these and other factors carefully before making any investment decisions and we urge you to avoid placing undue reliance on forward-looking statements.
The S&P 500 Composite Index (“Index”) is a product of S&P Dow Jones Indices LLC and/or its affiliates and has been licensed for use by Capital Group. Copyright © 2025 S&P Dow Jones Indices LLC, a division of S&P Global, and/or its affiliates. All rights reserved. Redistribution or reproduction in whole or in part are prohibited without written permission of S&P Dow Jones Indices LLC.
FTSE source: London Stock Exchange Group plc and its group undertakings (collectively, the "LSE Group"). © LSE Group 2025. FTSE Russell is a trading name of certain of the LSE Group companies. "FTSE®" is a trade mark of the relevant LSE Group companies and is used by any other LSE Group company under licence. All rights in the FTSE Russell indices or data vest in the relevant LSE Group company which owns the index or the data. Neither LSE Group nor its licensors accept any liability for any errors or omissions in the indices or data and no party may rely on any indices or data contained in this communication. No further distribution of data from the LSE Group is permitted without the relevant LSE Group company's express written consent. The LSE Group does not promote, sponsor or endorse the content of this communication. The index is unmanaged and cannot be invested in directly.
BLOOMBERG® is a trademark and service mark of Bloomberg Finance L.P. and its affiliates (collectively “Bloomberg”). Bloomberg or Bloomberg’s licensors own all proprietary rights in the Bloomberg Indices. Neither Bloomberg nor Bloomberg’s licensors approves or endorses this material, or guarantees the accuracy or completeness of any information herein, or makes any warranty, express or implied, as to the results to be obtained therefrom and, to the maximum extent allowed by law, neither shall have any liability or responsibility for injury or damages arising in connection therewith.
MSCI does not approve, review or produce reports published on this site, makes no express or implied warranties or representations and is not liable whatsoever for any data represented. You may not redistribute MSCI data or use it as a basis for other indices or investment products.
Capital believes the software and information from FactSet to be reliable. However, Capital cannot be responsible for inaccuracies, incomplete information or updating of the information furnished by FactSet. The information provided in this report is meant to give you an approximate account of the fund/manager's characteristics for the specified date. This information is not indicative of future Capital investment decisions and is not used as part of our investment decision-making process.
Indices are unmanaged and cannot be invested in directly. Returns represent past performance, are not a guarantee of future performance, and are not indicative of any specific investment.
All Capital Group trademarks are owned by The Capital Group Companies, Inc. or an affiliated company in Canada, the U.S. and other countries. All other company names mentioned are the property of their respective companies.
Capital Group funds are offered in Canada by Capital International Asset Management (Canada), Inc., part of Capital Group, a global investment management firm originating in Los Angeles, California in 1931. Capital Group manages equity assets through three investment groups. These groups make investment and proxy voting decisions independently. Fixed income investment professionals provide fixed income research and investment management across the Capital organization; however, for securities with equity characteristics, they act solely on behalf of one of the three equity investment groups.
The Capital Group funds offered on this website are available only to Canadian residents.