Global Equities
Categories
Portfolio Construction
Three under-the-radar themes for the rest of 2021
By now, advisors have already read through scores of outlook-related pieces for 2021. But there are several less-obvious investment trends within the well-covered mega-themes that Capital Group is closely monitoring. These insights are informed by Capital Group’s access to asset-flow data and insights from Capital Group’s regular reviews of advisors’ portfolios. As you examine your portfolios and prepare for conversations with clients about your outlook for the remainder of 2021, here are several additional insights to consider.
To read the full article, become an Insider. Already an Insider? Log in.
KEY TAKEAWAYS
- International equities: Focus on companies, not regions
- Fixed income: Core bonds have delivered whether rates are up, down or flat
- Digital leaders are leaving competitors behind, but not all experiences can be digitized
In 2020, investors saw an entire market cycle take place within just a few months. But it wasn’t just COVID-19 that advisors had to navigate for their clients — social unrest and a contested U.S. presidential election contributed to the tumultuous investment environment.
By now, advisors have already read through scores of outlook-related pieces for 2021. Those pieces widely covered some of the key themes of 2021: the potential for international equities to outperform, the “lower for longer” interest rate environment and the importance of digital leaders vs. digital laggards. But there are several less-obvious trends within these mega-themes that Capital Group is closely monitoring. These insights are informed by Capital Group’s access to asset-flow data and insights from Capital Group’s regular reviews of advisors’ portfolios.
As you examine your portfolios and prepare for conversations with clients about your outlook for the remainder of 2021, here are several additional insights to consider.
International equities: Focus on companies, not regions
U.S. equities have outperformed international equities for so long that it seems to be just a matter of time until international equities take the lead again. And after a decade of strength, the U.S. dollar may be at a turning point. Historically low interest rates, growing government debt and a muddled economic picture sent the U.S. dollar to multi-year lows in 2020. The weakening dollar, combined with relatively high U.S. equity valuations, could be the catalysts that international investors have been waiting for.
What is commonly overlooked in the U.S. vs. international debate, however, is that while U.S. stocks have outperformed international stocks as a whole, three-quarters of the best-performing companies over the last decade have been located outside of the U.S. This supports Capital Group’s belief that performance of international equities is more company-specific rather than industry- or region-specific — highlighting the importance of selectivity in international investing. This point is further illustrated in emerging markets, where company-specific factors are increasingly important drivers of company returns relative to country/region- or sector/industry-specific factors.
Non-U.S. companies have dominated the list of best performers over the past decade
In every year since 2011, the majority of the best-performing companies have been located outside the U.S. In the previous decade, an average of 75% of the top 50 best-performing companies each year in the MSCI ACWI Index were non-U.S. companies.
Share of top 50 performers in MSCI ACWI Index represented by non-U.S. companies.
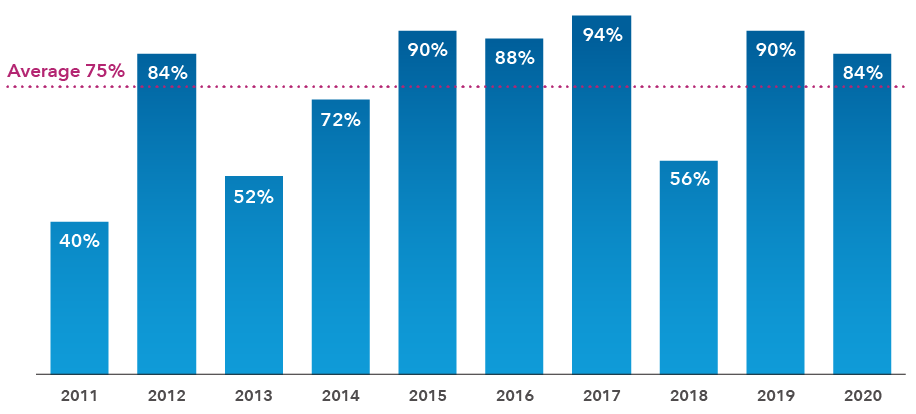
Sources: RIMES, MSCI. Data as of 12/31/2020.
Company-specific factors are the most important drivers of returns in emerging markets
Many investors may still view emerging markets investing as more of a top-down, country-specific strategy. That approach may have had some merit 30 years ago, but it makes much less sense today. Company-specific factors drive nearly two-thirds of performance in emerging markets.
Composition of emerging market returns
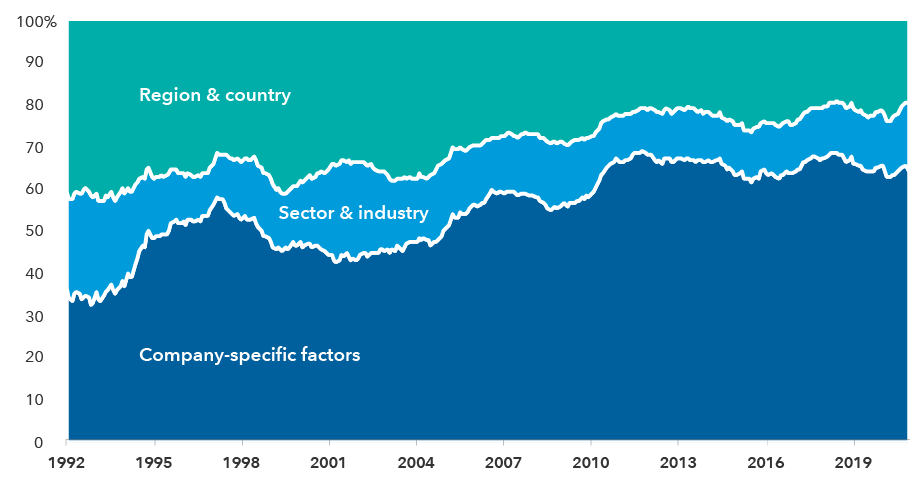
Source: Empirical Research Partners. Data as of December 31, 2020. Data shows the percentage of emerging markets’ return that can be attributed to various factors over time, using a two-year smoothed average.
As you examine your clients’ international exposure, keep in mind that geographic diversification in terms of domicile doesn’t always tell the full story. In fact, Capital Group’s portfolio consulting team has found that many advisors may only view geographic diversification by domicile instead of by revenue source, which can lead to imprecise portfolio construction.
Fixed income: Core bonds have delivered whether rates are up, down or flat
Many investors may think that bonds no longer have a place in a portfolio given today’s ultra-low-rate environment. But core bonds have shown a consistent ability to deliver positive returns and diversify equity exposure.
“No matter the environment, a high-quality core bond fund is critical to act as a ballast and help fortify your portfolio for whatever the future holds,” says Mike Gitlin, head of fixed income at Capital Group. “While total returns may be more modest in the coming years, the need for diversification, capital preservation, income and inflation protection in a balanced portfolio hasn’t lessened.”
While some advisors may be hesitant to invest in core bonds at a time when interest rates seemingly have nowhere to go but up, this asset class has provided value in all types of rate environments over the past two decades. When the Fed hiked interest rates by more than 4% between 2003 and 2006, the core benchmark Bloomberg Barclays U.S. Aggregate Index still saw a positive return of 1.8%. When rates remained near their lower bound of 0% during the recovery from the Global Financial Crisis from 2008 to 2015, core bonds gained 4.3%. And during the mixed environment of hiking and modest cuts from 2015 to early 2020, core bonds gained 4.0%.
Core bonds have held up in varying interest rate environments
During periods of rising rates, flat rates and mixed rates, core bonds have delivered positive returns while doing their job of diversifying equity exposure and preserving capital.
Federal funds rate (blue line) vs. returns of core bonds (magenta boxes)

Sources: Bloomberg Index Services Ltd., Federal Reserve. As of 12/31/2020. Year marks shown for June of each year. “Core bonds” benchmark shown is the Bloomberg Barclays U.S. Aggregate Index. Periods shown span from 6/26/2003 to 6/29/2006, 12/17/2008 to 12/15/2015, 12/16/2015 to 3/15/2020 and 6/26/2003 to 12/31/2020. Returns are in USD. Indexes are unmanaged and, therefore, have no expenses. Investors cannot invest directly in an index.
As you review your fixed income portfolios, it is important to ensure that portfolio construction aligns with your clients’ objectives. Capital Group’s recent analysis of advisors’ portfolios shows that this often isn’t the case. Although the vast majority of advisors state that equity risk diversification is the top objective for their fixed income portfolios, Capital Group’s analysis shows that many advisors unknowingly create more income-focused portfolios. Failing to recognize this bias can lead advisors to take on excessive risk in fixed income, which can be particularly painful when volatility spikes as it did in early 2020.
Digital leaders are leaving competitors behind, but not all experiences can be digitized
The digital gap has been a defining characteristic of equity markets for several years — and the pandemic quickly turned it into a chasm. Companies with fast and efficient online business models have strongly outperformed digital laggards, disrupting entire industries and displacing many old-economy stalwarts.
Research from McKinsey1 outlines several behavioral changes due to COVID-19 that are likely to stick. McKinsey’s research shows huge, sustainable growth in online purchasing activity (15%–30% growth in consumers who purchase and expect to continue purchasing online for most categories of goods), as well as major changes to consumer company/brand loyalty (75% of consumers have tried a new shopping behavior, and most intend to continue it beyond the crisis).
“We were already headed in this direction when COVID came along and gave it a huge shove forward,” says portfolio manager Chris Buchbinder. “The growth rates at companies with a digital advantage have been phenomenal during the downturn and, in my view, we’re not going back. When the pandemic is over, we may see slower growth rates, but I don’t think many people will be canceling their Netflix subscriptions or returning their Peloton bikes.”
But it’s important to keep in mind that the digital advantage only goes so far, and there are likely many overlooked opportunities that aren’t closely tied to digital transformation. While it is a powerful force in many industries, there are some places where digital expertise takes a back seat to manufacturing muscle. As Buchbinder says, “There are no digital aircraft engines.” In addition, some consumer experiences can’t be digitized, and industries like travel and hospitality are expected to rebound strongly in 2021.
Pent-up demand: Some experiences can’t be digitized
In China, where COVID-19 is largely under control and the economy has rebounded, domestic air travel has nearly returned to pre-pandemic levels.
China vs. U.S. domestic air travel (change from previous year)
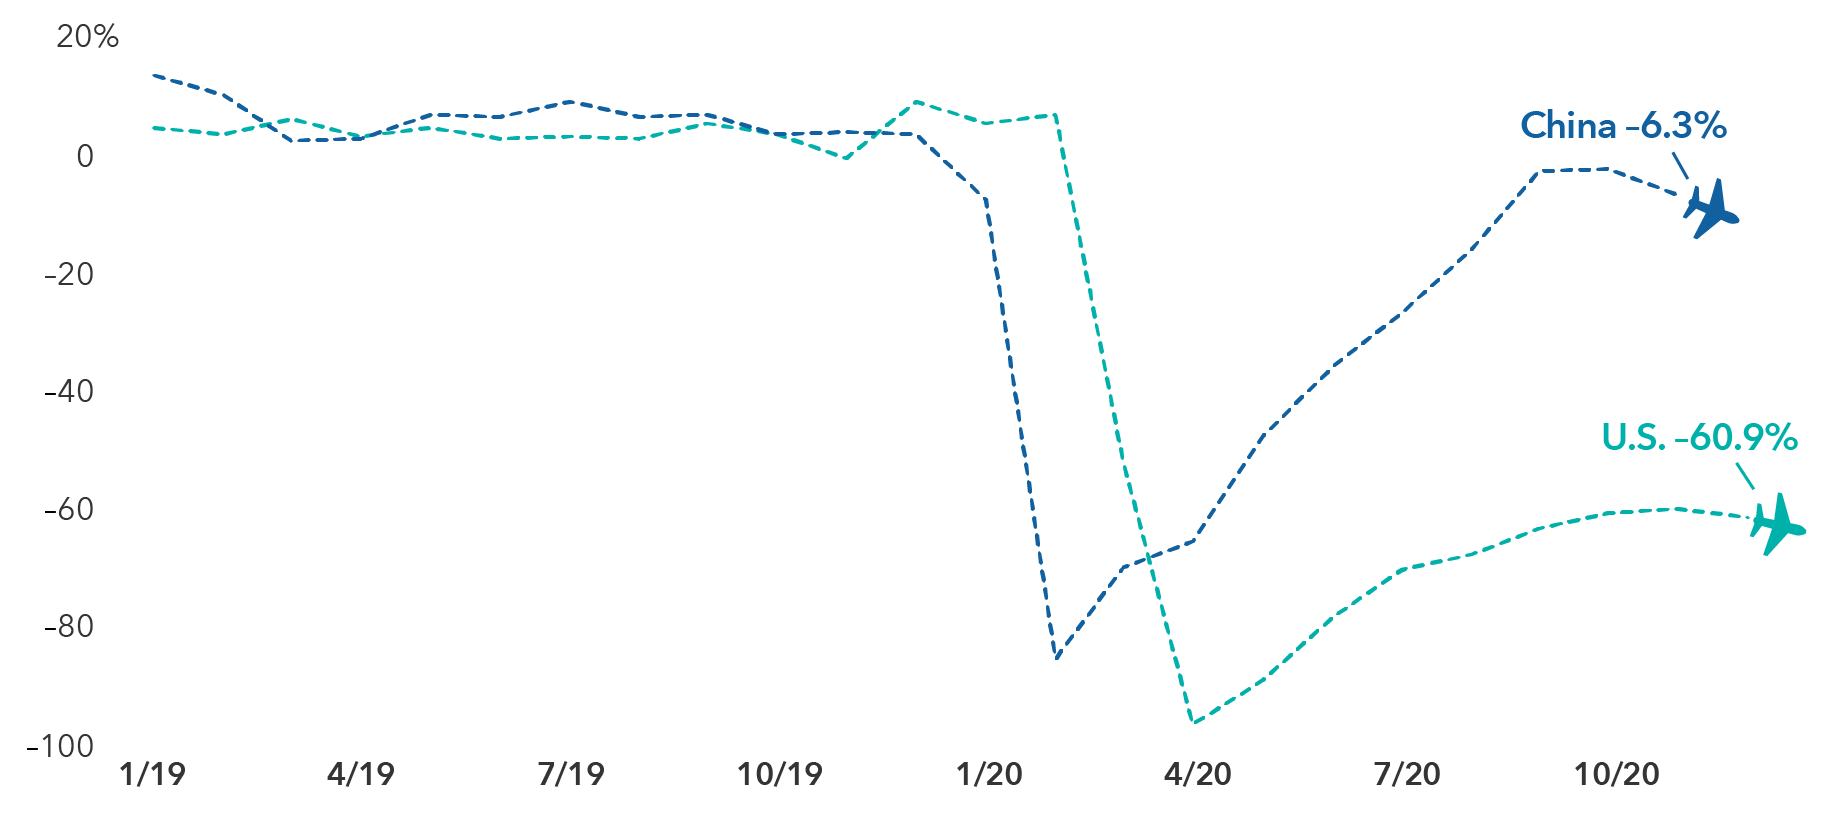
Sources: Capital Group, Bloomberg, Bureau of Transportation Statistics. China data is the change in combined revenue passenger kilometers of the three largest Chinese airlines and is through 11/30/2020. U.S. data is the change in U.S. airline passengers and is through 12/31/2020.
Capital Group’s recent reviews of advisors’ portfolios show that most advisors are heavily skewed toward growth stocks — which tend to include digital leaders. As advisors consider pivoting some of their portfolios back toward value, it is important to remember that value doesn’t necessarily equate to quality. For example, as of June 30, 2020, more than 40% of the Russell 1000 Value Index is made up of sub-investment grade companies, many of which don’t pay dividends. In addition, Capital Group’s portfolio reviews show that advisors’ value portfolios are often highly correlated with growth portfolios. Once again, it is important to ensure that portfolio construction is aligned with portfolio objectives.
Examine your portfolios to avoid common pitfalls in 2021
Are you interested in discussing how to put these themes to work for your clients? Are you curious about how your portfolios stack up relative to other advisors? If you’re a financial professional interested in getting a checkup on your clients’ portfolios, Capital Group can help. Request a personal consultation from one of our portfolio specialists to help you address your clients’ specific investment needs and goals, helping to prepare them for 2021 — and for the years ahead.
1 Source: McKinsey & Company, August 2020. “The Great consumer shift: Ten charts that show how US shopping behavior is changing.”
Learn more about
For financial professionals only. Not for use with the public.
Investing outside the United States involves risks, such as currency fluctuations, periods of illiquidity and price volatility, as more fully described in the prospectus. These risks may be heightened in connection with investments in developing countries.
MSCI ACWI is a free float-adjusted market capitalization-weighted index that is designed to measure equity market results in the global developed and emerging markets, consisting of more than 40 developed and emerging market country indexes.
MSCI has not approved, reviewed or produced this report, makes no express or implied warranties or representations and is not liable whatsoever for any data represented. You may not redistribute MSCI data or use it as a basis for other indices or investment products.
Bloomberg Barclays U.S. Aggregate Index represents the U.S. investment-grade fixed-rate bond market.
Bloomberg® is a trademark of Bloomberg Finance L.P. (collectively with its affiliates, “Bloomberg”). Barclays® is a trademark of Barclays Bank Plc (collectively with its affiliates, “Barclays”), used under license. Neither Bloomberg nor Barclays approves or endorses this material, guarantees the accuracy or completeness of any information herein and, to the maximum extent allowed by law, neither shall have any liability or responsibility for injury or damages arising in connection therewith.
Russell 1000 Value Index is a market capitalization-weighted index that represents the large-cap value segment of the U.S. equity market and includes stocks from the Russell 1000 Index that have lower price-to-book ratios and lower expected growth values.
FTSE/Russell indexes: London Stock Exchange Group plc and its group undertakings (collectively, the “LSE Group”). © LSE Group 2021. FTSE Russell is a trading name of certain of the LSE Group companies. FTSE indexes are trademarks of the relevant LSE Group companies and are used by any other LSE Group company under license. All rights in the FTSE Russell indexes or data vest in the relevant LSE Group company which owns the index or the data. Neither LSE Group nor its licensors accept any liability for any errors or omissions in the indexes or data and no party may rely on any indexes or data contained in this communication. No further distribution of data from the LSE Group is permitted without the relevant LSE Group company’s express written consent. The LSE Group does not promote, sponsor or endorse the content of this communication.
To read the full article, become an RIA Insider. You'll also gain complimentary access to news, insights, tools and more.
Already an Insider?
RELATED INSIGHTS
-
-
Emerging Markets
-
Global Equities
Investments are not FDIC-insured, nor are they deposits of or guaranteed by a bank or any other entity, so they may lose value.
Investors should carefully consider investment objectives, risks, charges and expenses.
This and other important information is contained in the fund prospectuses and summary prospectuses, which can be obtained from a financial professional and should be read carefully before investing.
Statements attributed to an individual represent the opinions of that individual as of the date published and do not necessarily reflect the opinions of Capital Group or its affiliates. This information is intended to highlight issues and should not be considered advice, an endorsement or a recommendation.
All Capital Group trademarks mentioned are owned by The Capital Group Companies, Inc., an affiliated company or fund. All other company and product names mentioned are the property of their respective companies.
Use of this website is intended for U.S. residents only.
On or around July 1, 2024, American Funds Distributors, Inc. will be renamed Capital Client Group, Inc.
This content, developed by Capital Group, home of American Funds, should not be used as a primary basis for investment decisions and is not intended to serve as impartial investment or fiduciary advice.
For financial professionals only. Not for use with the public.