Fed
 Margaret Steinbach
 Tim Ng
The U.S. Federal Reserve hiked its benchmark interest rate by 75 basis points (bps) for the third consecutive time, reaffirming its commitment to rein in inflation. Fed Chair Jerome Powell repeated the hawkish message he delivered at Jackson Hole last month: The central bank will continue tightening policy until inflation decelerates convincingly toward its 2% target — and the bar is high for this path to change.
“Restoring price stability will require maintaining a restrictive policy stance for some time. The historical record cautions strongly against prematurely loosening policy,” Powell said this week. “We have got to get inflation behind us. I wish there were a painless way to do that. There isn't.”
Stocks fell after the Fed’s announcement, with the S&P 500 Index closing down 1.7%.
This comes after the August consumer price index (CPI) report dashed hopes that inflation was coming under control and reinforces the notion that Fed leadership intends to push its policy rate into restrictive territory. For historical context, in monetary cycles prior to 2000, the Fed raised rates until real policy rates were hundreds of basis points above zero.
Here are the latest views from fixed income portfolio manager Tim Ng and investment director Margaret Steinbach on the U.S. economy as well as positioning fixed income portfolios in this environment.
Economic backdrop
- Inflationary pressures are broad-based (around 40% of the CPI basket is experiencing inflation above 10%) and so-called “sticky” drivers, such as owner-equivalent rents, of inflation are still accelerating. This suggests we may need to see broad-based weakness in the economy to bring inflation down to more reasonable levels.
High inflation is broad-based
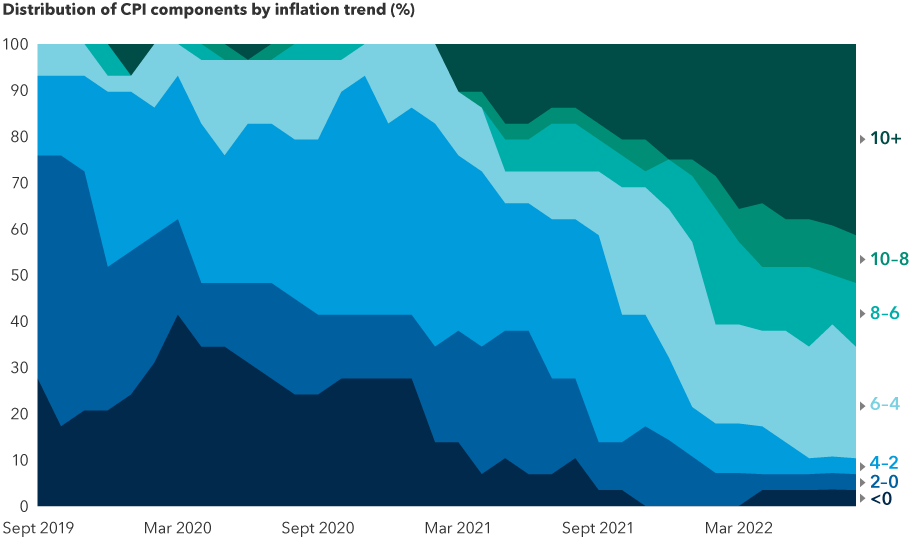
Source: Capital Group, Bureau of Labor Statistics. Data as of September 20, 2022. This chart shows the percentage of component categories within the Consumer Price Index (CPI) that have experienced inflation within select ranges from September 2019 through August 2022. The percentage of CPI components experiencing inflation of 10% or greater reached nearly 40% in August 2022.
- The impact of significantly tighter financial conditions is starting to weigh on sentiment and activity, particularly in interest-rate-sensitive sectors such as housing. Existing home sales fell for a seventh consecutive month in August.
- Economic data shows U.S. consumers have remained resilient. A tight labor market, rising wages and credit growth have supported consumer spending, partially offsetting the shocks of inflation and tighter financial conditions. There has been a continued shift from goods to service inflation, which will likely remain elevated, given consumer strength.
Sticky inflation indexes are accelerating
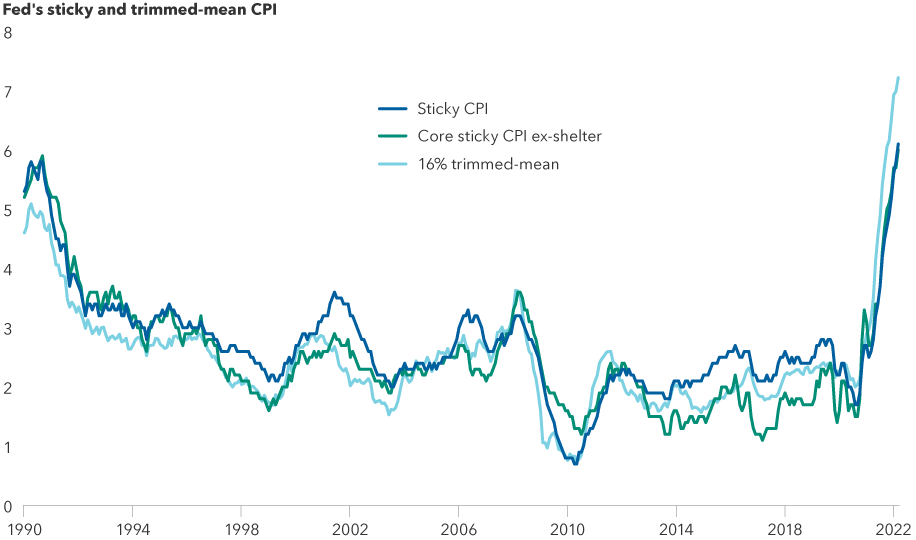
Source: Capital Group, Federal Reserve Bank of Atlanta, Federal Reserve Bank of Cleveland. Data as of September 20, 2022. The “sticky” and “core sticky ex-shelter” CPI indexes, published by the Atlanta Fed, show the change in price among components of the consumer price index which have been historically slow to change. The 16% trimmed-mean CPI, published by the Cleveland Fed, show inflation rates of CPI components which fall between the 92nd percentile and 8th percentile of price changes.
Policy fundamentals
- The Fed appears unwilling to stop the hiking cycle yet and will likely continue with aggressive hikes in the near term, despite growing headwinds to economic growth.
- As the economic backdrop weakens, the Fed may be slow to react, given persistently high inflation. Fed Chair Powell appears to be conscious of his legacy and does not seem to want to be remembered as being too easy on inflation.
- While fiscal spending has been muted this year, the trend may reverse (both in the U.S. and Europe) and could provide further inflationary pressure.
Valuations
- With the recent rise in yields and markets pricing in a peak fed funds rate above 4%, the front end of the curve appears fairly priced. The long end of the curve remains relatively unattractive, in our view. Real yields on the long end of the curve, however, have become attractive.
- The yield curve is extremely flat compared to history, with all major curve pairs in the richest 15th percentile since the early 1970s. Significant further flattening appears unlikely to occur unless inflation re-accelerates.
- The gap between market-implied break-even inflation and realized inflation has widened to an extreme level, as break-evens have declined meaningfully.
Positioning thoughts
Our base case is that financial conditions are likely to tighten further as the Fed continues to aggressively raise rates to fight inflation. Given current valuations, however, our rates team members have added duration in the portfolios they manage to move from underweight toward neutral.
The fed funds terminal rate was priced around 4.4% following the August CPI report. The Fed’s new “dot plot” shows central bank officials believe the fed funds rate could reach 4.6% in 2023. Risks to duration feel balanced at these valuations, considering persistent inflation and downside risks to growth from tighter financial conditions.
Members of our rates team continue to hold Treasury Inflation-Protected Securities (TIPS) in the portfolios they manage, given their appealing valuations. We believe market expectations for future inflation are too low.
Yield curve steepeners (which benefit when the difference between long- and short-term interest rates increases) appear attractive, given the current entry point. We see the potential for asymmetric risk-reward with this position, given little room for further flattening and potential for meaningful upside if economic growth slows or if the Fed under-delivers on the market’s expectation for rate hikes.
S&P 500 Index is a market capitalization-weighted index based on the results of approximately 500 widely held common stocks.
The S&P 500 Index (“Index”) is a product of S&P Dow Jones Indices LLC and/or its affiliates and has been licensed for use by Capital Group. Copyright © 2022 S&P Dow Jones Indices LLC, a division of S&P Global, and/or its affiliates. All rights reserved. Redistribution or reproduction in whole or in part are prohibited without written permission of S&P Dow Jones Indices LLC.
Institutional investors rely on our newsletter. Have you subscribed?
Our latest insights
-
-
-
Interest Rates
-
Municipal Bonds
-
Artificial Intelligence
RELATED INSIGHTS
-
-
Chart in Focus
-
Don’t miss out
Get the Capital Ideas newsletter in your inbox every other week