Municipal Bonds
 Neil Amirtha
 Greg Ortman
- It’s a myth that Fed hikes are always bad news for munis
- Treasury yields are a major influence on muni returns
- Relative value varies widely with muni bond maturity
Not so long ago, the key question was: will they, or won’t they? Now, when it comes to the U.S. Federal Reserve and rate hikes, investors are simply wondering how high rates could go and for how long?
Interest rate hikes are taking center stage. For municipal bond investors, this is happening at a time when two other potential developments are already under the spotlight: higher income taxes and massive infrastructure spending.
Tax changes and federal spending — on bridges and roads, among other things — should act as tailwinds to munis. The asset class’s tax exemptions could become even more valued, while hundreds of billions of dollars of new capital should bolster fundamentals.
But what about higher rates — tailwind or headwind? Answer is: It’s complicated. You might assume Fed hikes will inevitably have a negative impact. After all, the values of bonds fall when yields climb — as they often have around Fed hikes.
While bond math doesn’t lie, it’s not the whole story. Here are three facts that could change your thinking about municipal bonds and rising rates.
1. Fed hikes aren’t necessarily bad news for munis
With Fed hikes now front and center, it’s little wonder bond math (when yields rise, bond values decline) has spooked some investors.
So, if you’re feeling that now’s not the time to own muni bonds, history may offer a valuable insight. The last four times rates were raised demonstrate it’s possible for municipal bonds to show limited downside — or even gains — when the Fed hikes.
Gains, as well as modest declines: Municipal bonds and past Fed hikes
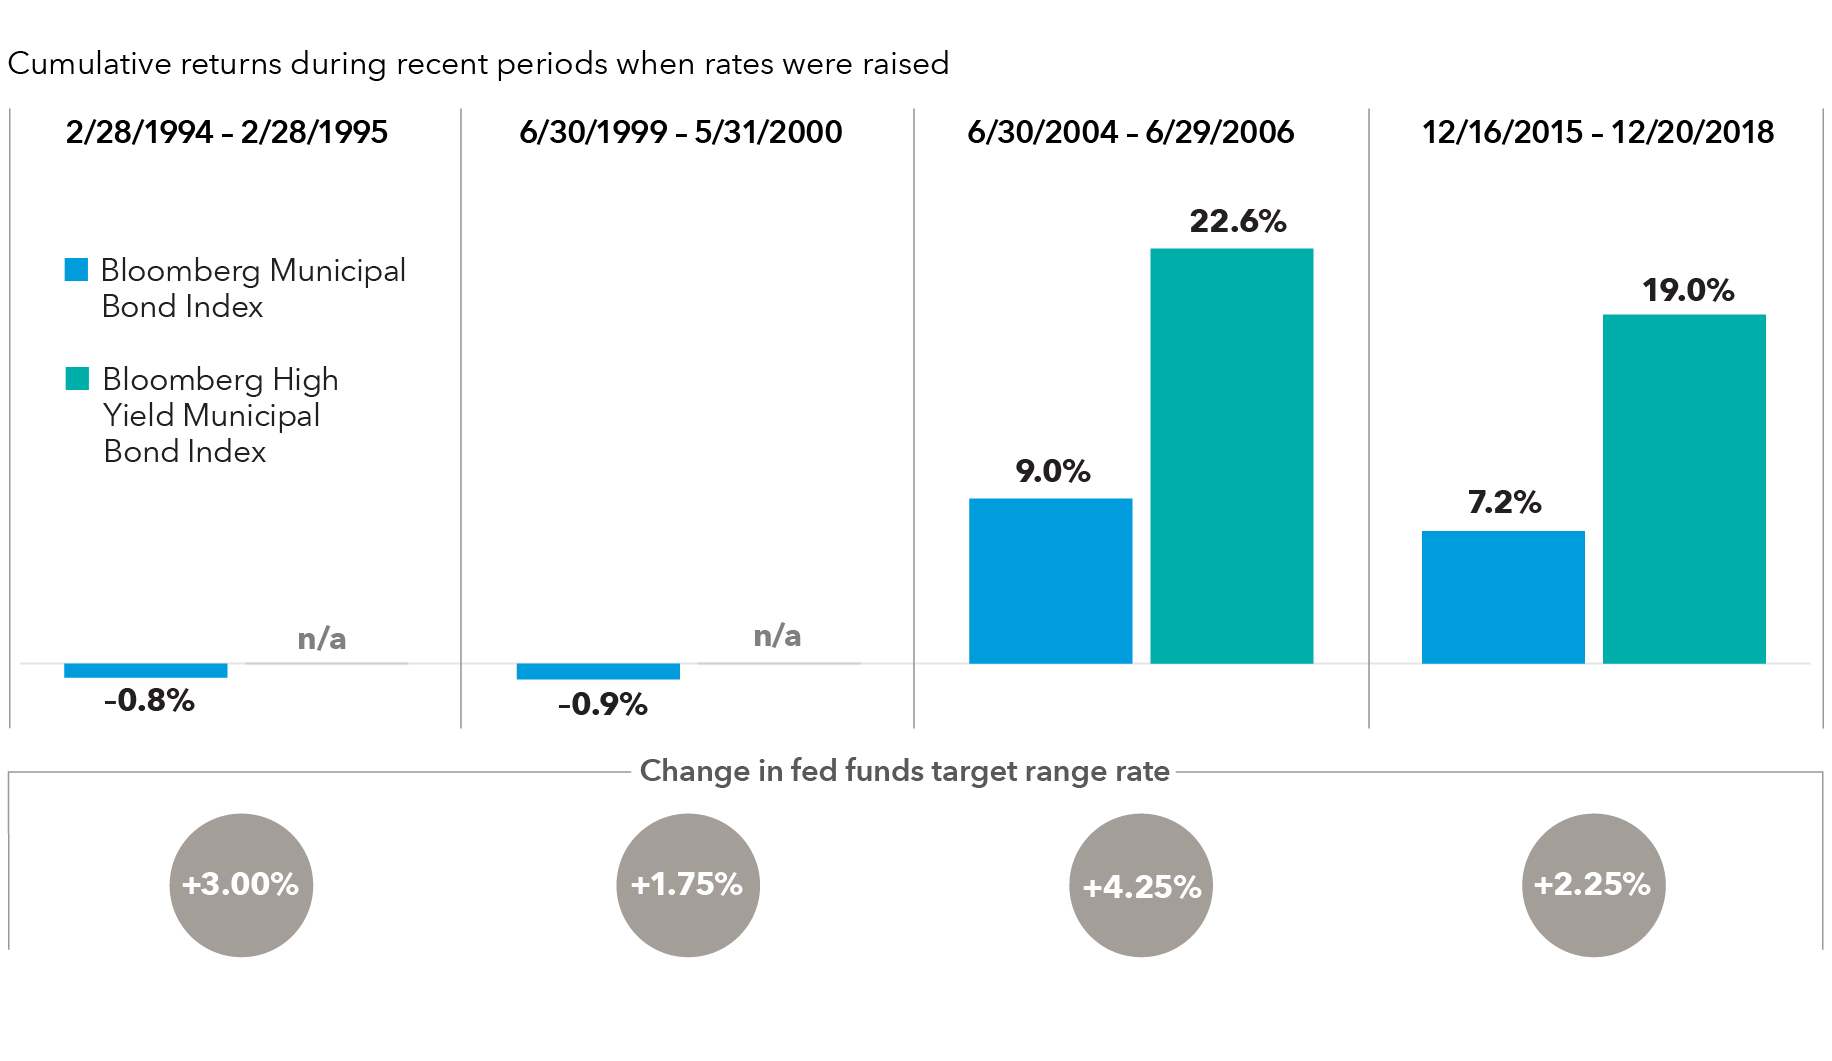
Source: Bloomberg Index Services Ltd. Daily returns unavailable prior to 2006; results prior to 2006 were calculated using nearest month-ends to the first and final hikes. High-yield muni results unavailable pre-2003.
2. Treasury yields are a major influence on muni returns
Surging inflation and debate over the Fed’s likely policy response can dominate the headlines and, on occasion, unsettle markets. Volatility among U.S. Treasuries will likely continue to spill over into municipals.
Although this dynamic is nothing new, it may have more of a profound impact on muni returns than in the past. To understand why, recall that, in simple terms, muni bond returns result from two components.
First, there’s the change in yield for Treasuries (assumed to be non-risky and, therefore, provide a baseline pricing for munis and other bond markets). The other component results from changes in the credit spread, which is the “extra” yield muni investors are paid over and above Treasuries; it reflects the non-zero risk of default for any bond issuer that isn’t Uncle Sam.
The reason Treasury yield moves may hold greater sway over municipal bond valuations in coming months is that spreads are near their multiyear lows and look poised to remain there. There’s limited scope for further declines, and a significant move higher appears unlikely. Massive pandemic-era fiscal support for states and local municipalities should help keep a lid on spreads for some time, reflecting healthy balance sheets and fundamentals.
So far in 2021, Treasury yield curve changes have been a drag on overall positive muni market returns.
Munis have eked out a modest gain lately, though higher Treasury yields took a toll
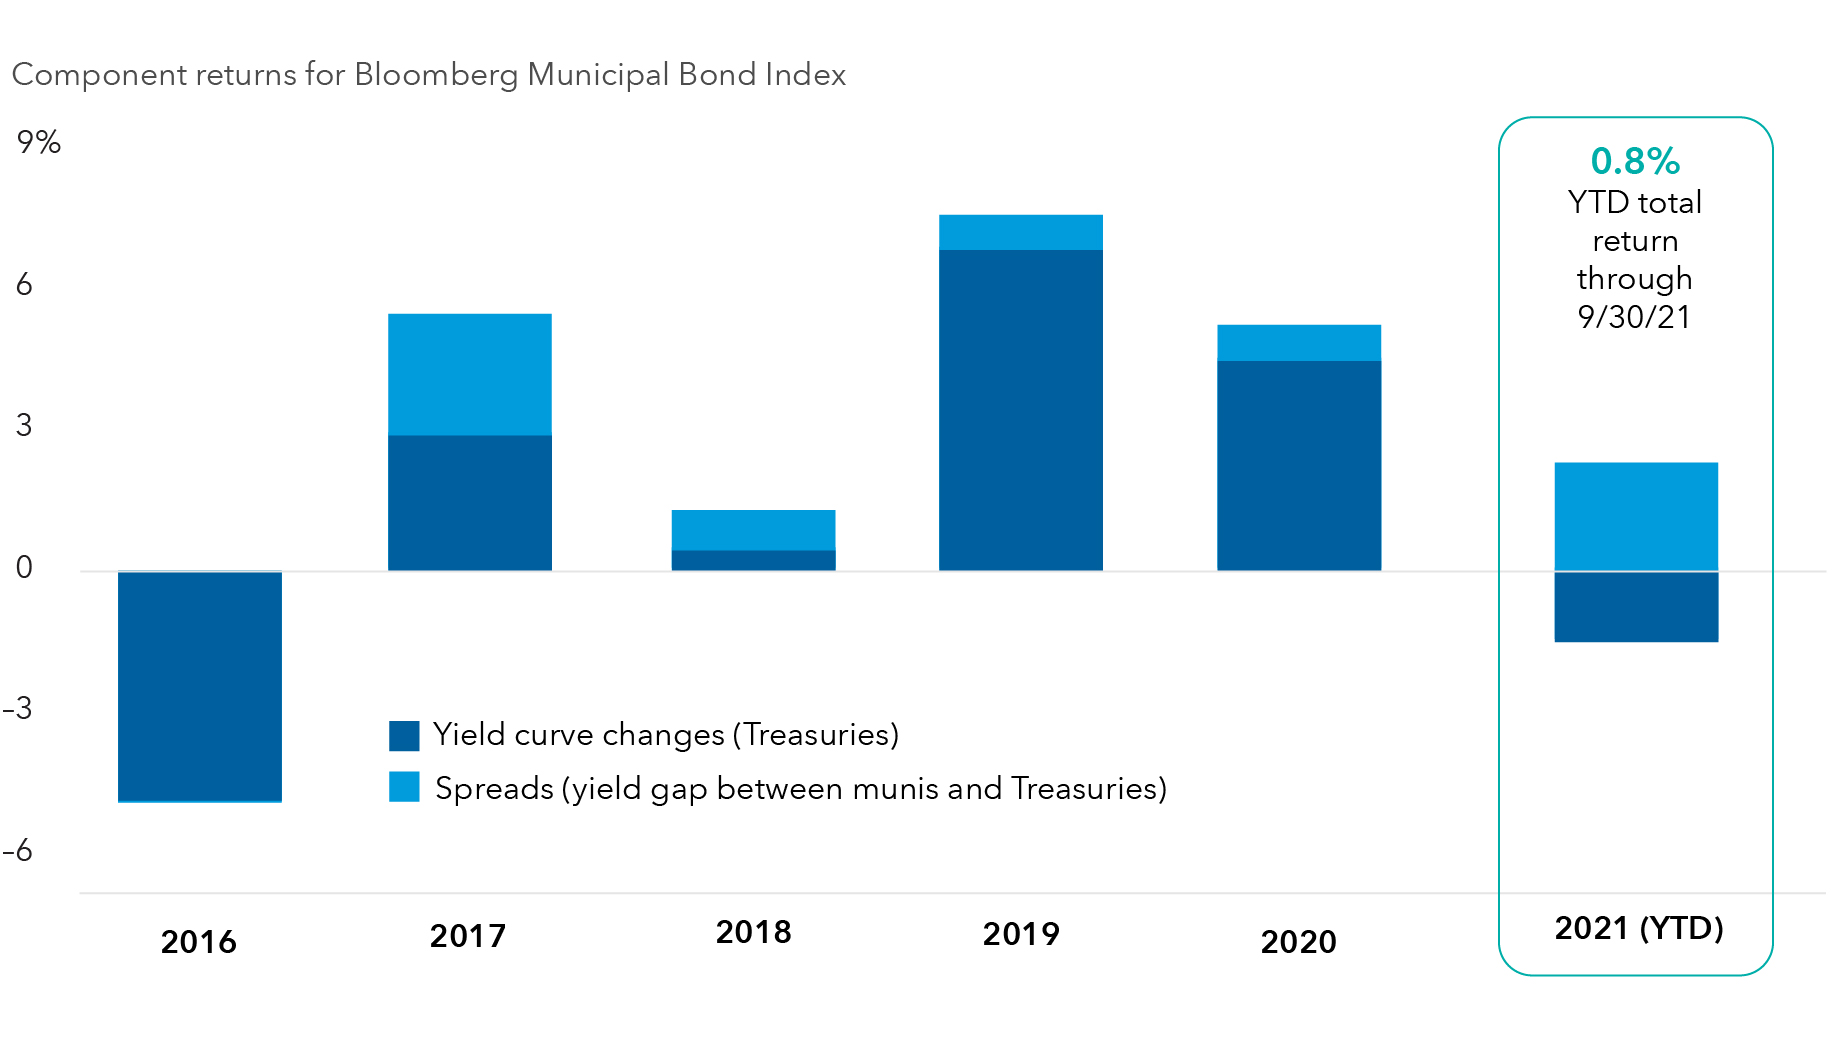
Source: Bloomberg Index Services Ltd. Components of index total returns as of 9/31/21.
3. Relative value varies widely with muni bond maturity
Relative value across the muni bond curve ebbs and flows. Lately, ratios — which express pretax AAA-rated municipal bond yields as a percentage of Treasury yields — have declined among shorter maturities. In comparison, intermediate and longer maturities have stayed relatively stable.
This notable move in relative value seems to have resulted from investors favoring the front-end of the curve, ahead of Fed rate hikes. Compared to issues with longer maturities, the values of short-term bonds tend to be more resilient as the prevailing level of interest rates climbs (in other words, they have a lower duration).
Front-end ratios have dropped as investors prepare for Fed hikes
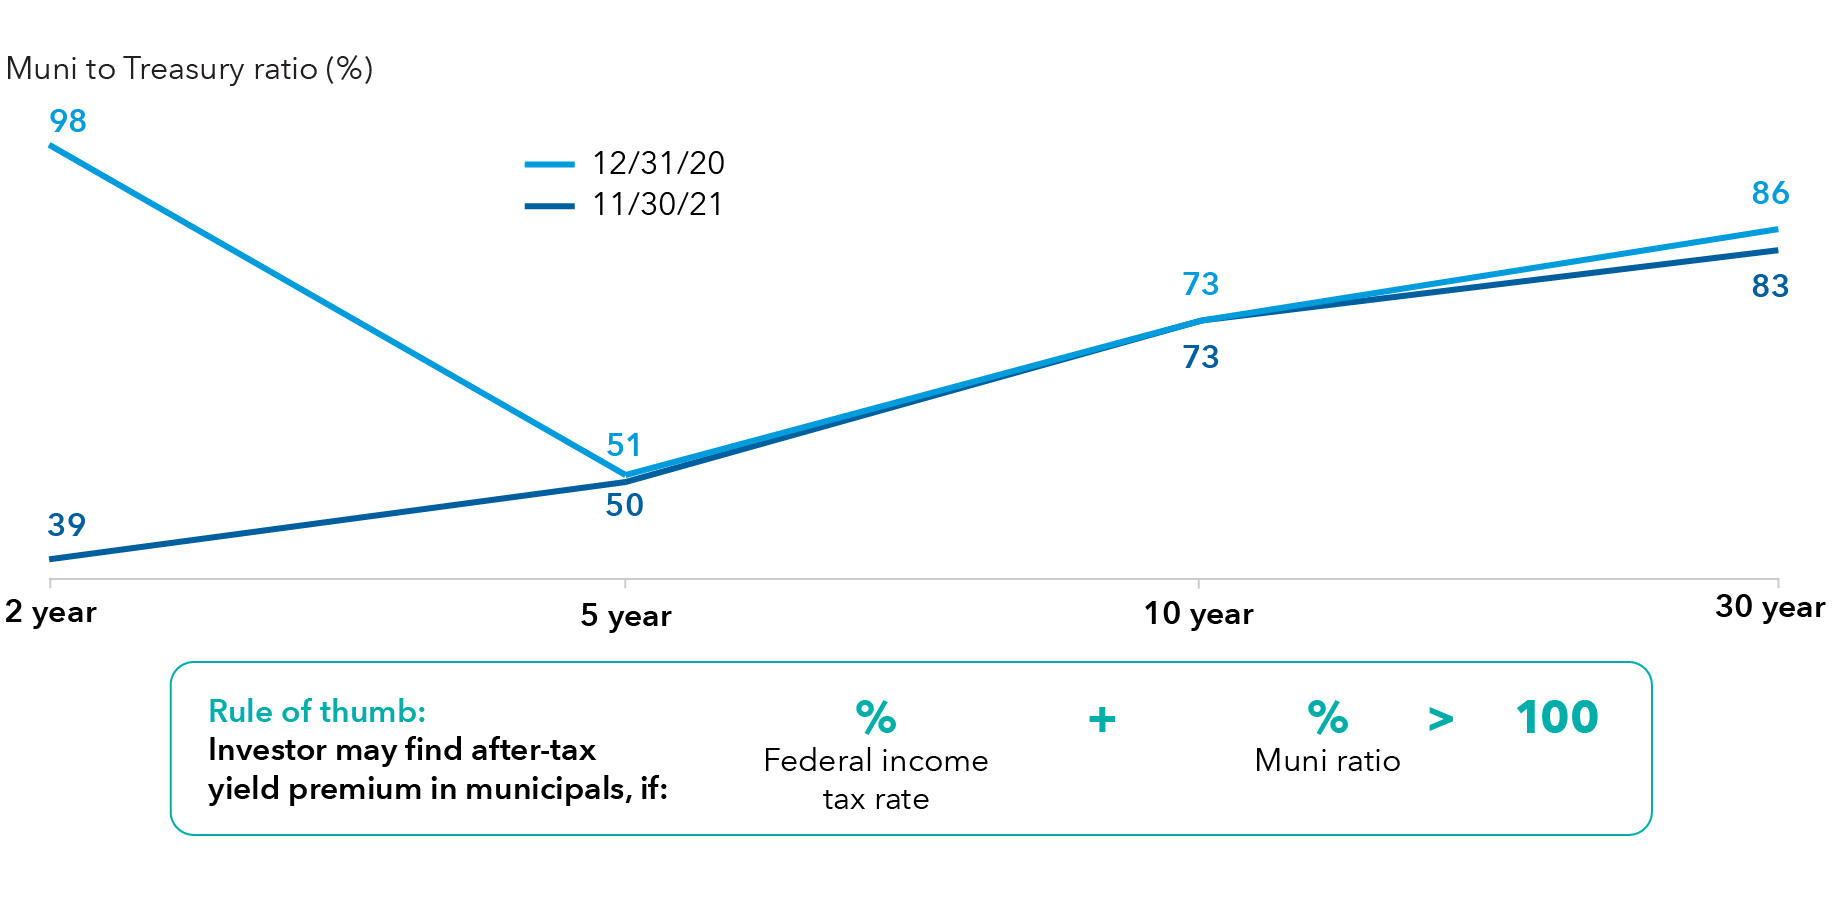
Source: Bloomberg Index Services Ltd. Data as of 11/30/21.
Ratios are a simple indicator of relative value. A level above 100 indicates municipal bonds are offering a yield premium, even without accounting for potential tax advantages.
In recent times, a ratio in the mid-60s and higher would suggest the tax benefits of munis could be especially attractive to an investor in the highest marginal federal income tax bracket (37%).
Over time, the specific muni maturities that have offered the highest and lowest returns has varied, further underscoring the potential benefits of taking a selective approach to investing.
Putting an emphasis on certain maturities could add value
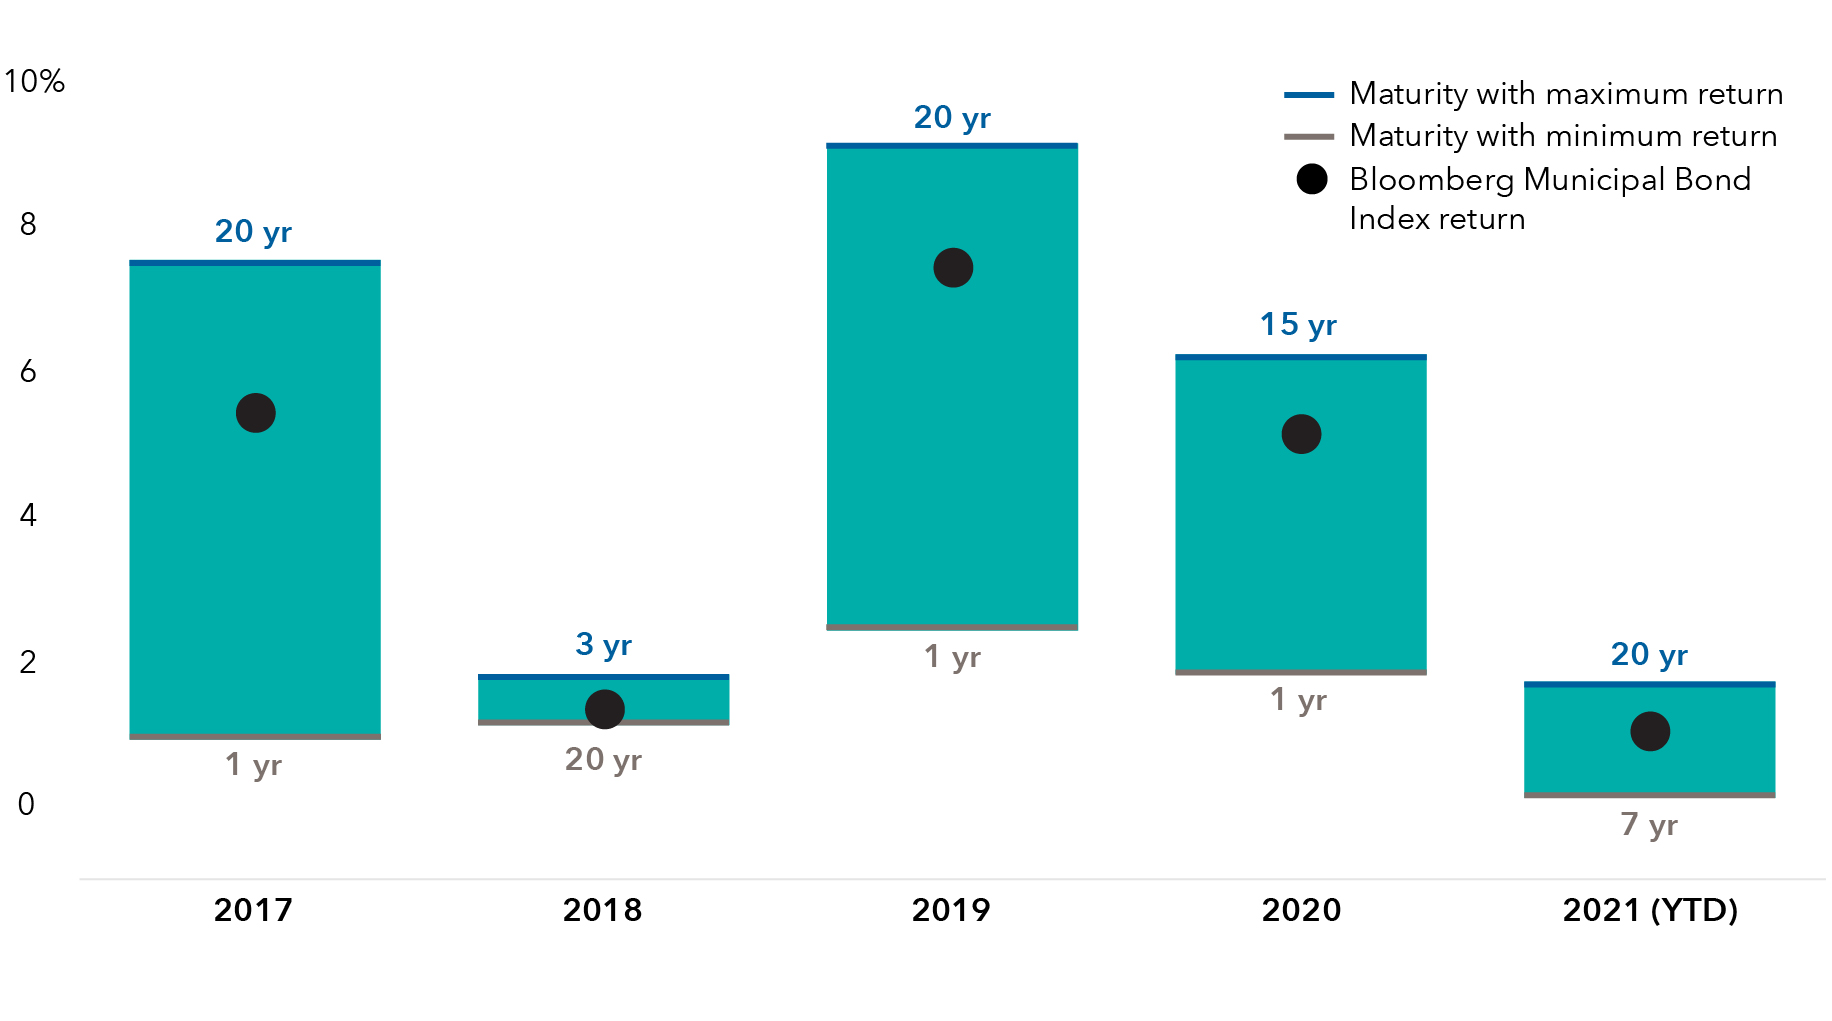
Source: Bloomberg Index Services, Ltd. Returns shown for the Bloomberg Municipal Bond Index, and the maturity buckets that notched the maximum and minimum returns; 2021 (YTD) is through 9/30/21.
Volatility is inevitable. Here’s how to be prepared
If recent history is a guide, Fed hikes won’t be the disaster for market returns that the bond bears claim.
That said, with markets pricing in rapid and aggressive Fed policy action, volatility could remain elevated. A defensive posture in regard to interest rates — possibly including an emphasis on municipal bonds of shorter maturity — seems prudent.
More broadly, the way that muni bond yields vary with maturity (that is, the shape of the muni curve) could also present opportunities for selective investors.
As yields for different maturities move up and down, the slope of certain segments of the curve shifts. Lately, longer term yields have risen relatively rapidly amid robust economic recovery and supportive monetary and fiscal policies.
The municipal bond curve has, historically, been steeper than its Treasury counterpart due to key differences in the buyer bases for the two markets. Crucially, future tax policy is more uncertain over longer periods. Longer maturity muni bonds have, therefore, often included a yield premium to reflect that uncertainty.
Intense investor demand at a time of more moderate issuance has resulted in the muni curve becoming less steep over the past year, though it has re-steepened more recently. In general, a steeper curve can be attractive to bond investors as it means that, with the passage of time, they should earn return from capital appreciation as well as a bond’s coupon.
Curve changes are another way that active investors can seek relative value
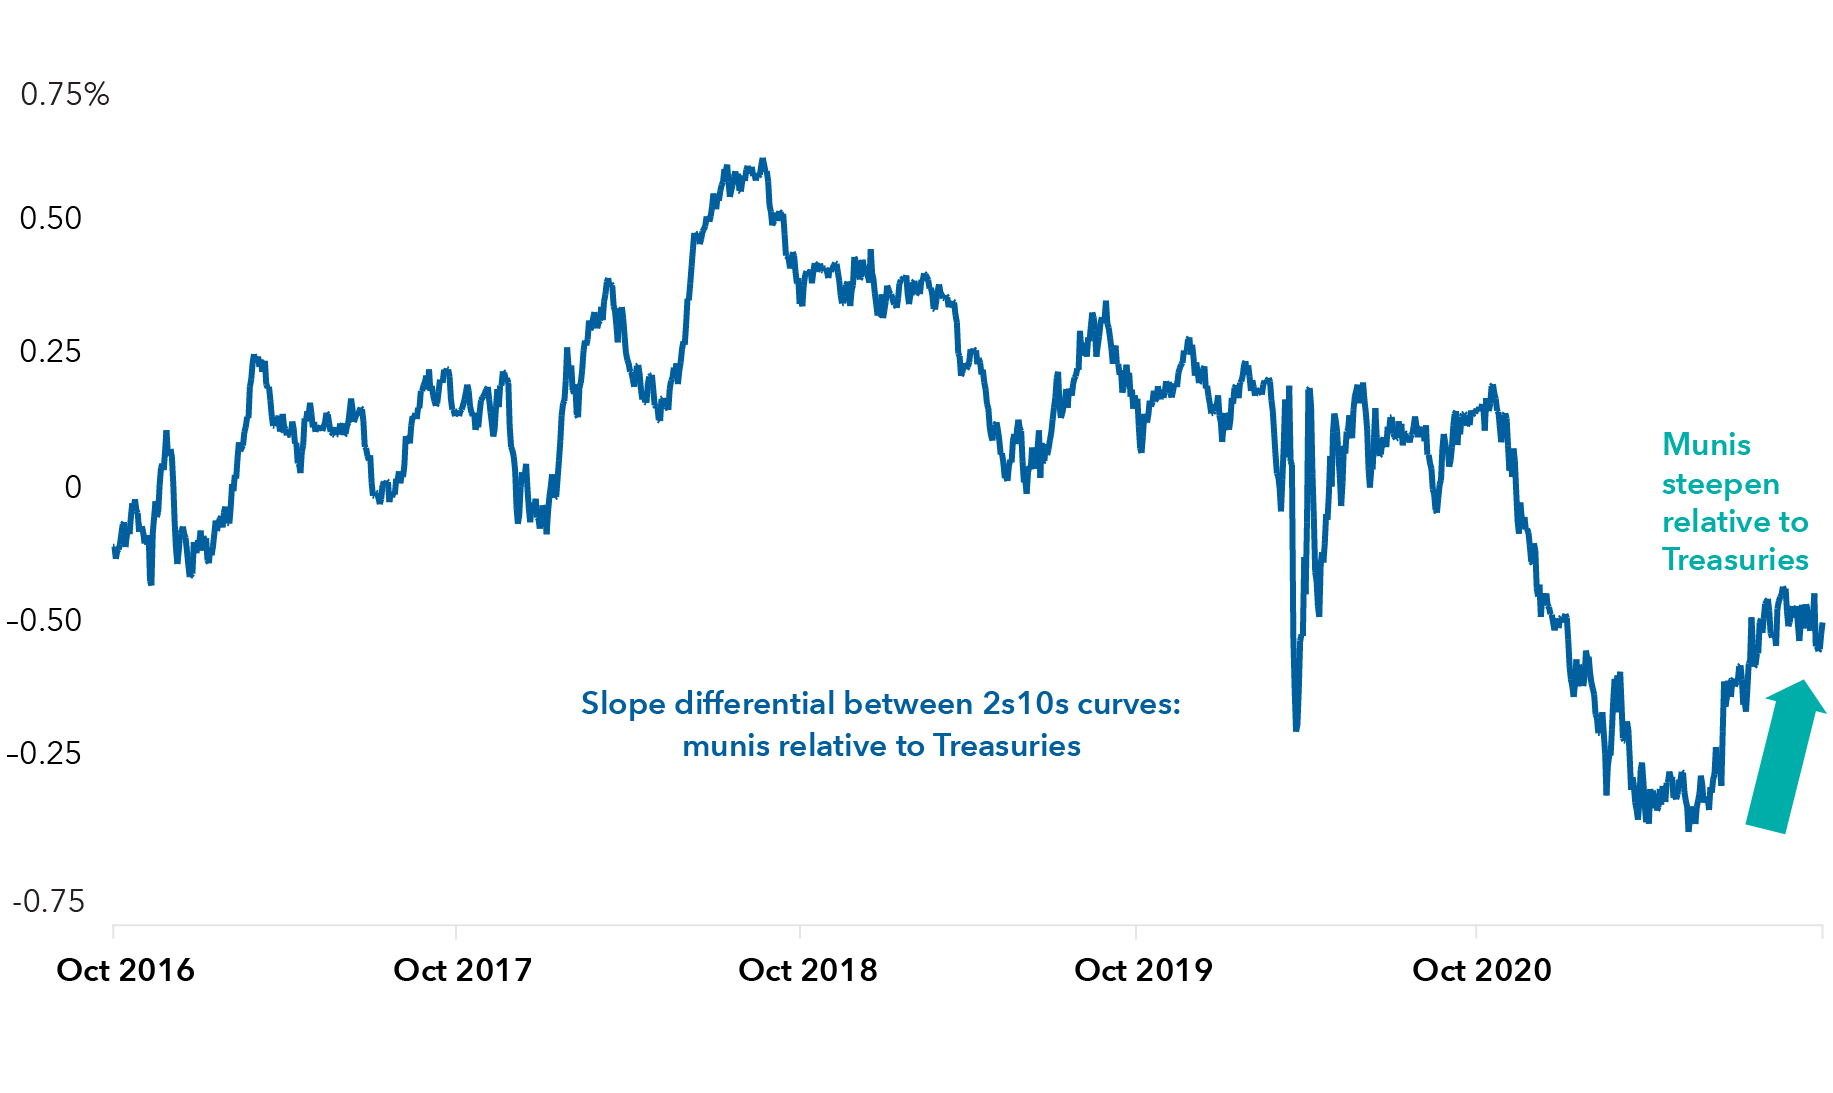
Source: Bloomberg Index Services, Ltd. Differential between the 2s10s curve (slope of segment between 2- and 10-year maturities) for the Bloomberg Municipal Bond Index and the U.S. Treasury yield curve, through 9/30/2021.
Looking forward, moderating long-term growth prospects could result in a flatter curve as muni yields at shorter maturities climb more swiftly. If, on the other hand, the Fed is able to normalize policy while inflation subsides, the curve could steepen as the growth outlook brightens.
Cast in this light, preparing for volatility doesn’t have to mean being uninvested. A changing rates environment may actually present opportunities for those investors with the research and execution capabilities to invest nimbly. For active muni investors, market setbacks can even have a silver lining: the opportunity to invest in bonds offering higher tax-exempt yields.
The market indexes are unmanaged and, therefore, have no expenses. Investors cannot invest directly in an index.
The return of principal for bond funds and for funds with significant underlying bond holdings is not guaranteed. Fund shares are subject to the same interest rate, inflation and credit risks associated with the underlying bond holdings. Lower rated bonds are subject to greater fluctuations in value and risk of loss of income and principal than higher rated bonds. Income from municipal bonds may be subject to state or local income taxes and/or the federal alternative minimum tax. Certain other income, as well as capital gain distributions, may be taxable.
Methodology for calculation of tax-equivalent yield:
Based on 2021 federal tax rates. Taxable equivalent rate assumptions are based on a federal marginal tax rate of 37%, the top 2021 rate. In addition, we have applied the 3.8% Medicare tax. Thus taxpayers in the highest tax bracket will face a combined 40.8% marginal tax rate on their investment income. The federal rates do not include an adjustment for the loss of personal exemptions and the phase-out of itemized deductions that are applicable to certain taxable income levels.
Bloomberg Municipal Bond Index is a market value-weighted index designed to represent the long-term investment-grade tax-exempt bond market. Bloomberg High Yield Municipal Bond Index is a market value-weighted index composed of municipal bonds rated below BBB/Baa. BLOOMBERG® is a trademark and service mark of Bloomberg Finance L.P. and its affiliates (collectively “Bloomberg”). Neither Bloomberg or Bloomberg’s licensors approves or endorses this material, or guarantees the accuracy or completeness of any information herein, or makes any warranty, express or implied, as to the results to be obtained therefrom, and, to the maximum extent allowed by law, neither shall have any liability or responsibility for injury or damages arising in connection therewith.
Our latest insights
-
-
-
Interest Rates
-
-
Municipal Bonds
RELATED INSIGHTS
-
Municipal Bonds
-
-
Emerging Markets
Never miss an insight
The Capital Ideas newsletter delivers weekly investment insights straight to your inbox.