Market Volatility
 Pramod Atluri
 Jared Franz
 Will Robbins
For more than a year, investors have wondered what might prompt the U.S. Federal Reserve to alter its aggressive rate-hiking path. The collapse of SVB Financial, parent company of Silicon Valley Bank, may have provided the answer.
The demise of the 16th largest bank in the United States has dramatically changed the interest rate outlook for the balance of 2023 — and beyond — as the market ponders how the Fed and other central banks will react to growing turmoil in the sector. With fear of contagion spreading, European banks also have come under pressure, forcing regulators to step in and shore up unsteady financial institutions.
Over the weekend, Swiss banking giant UBS agreed to acquire its longtime rival Credit Suisse for more than US$3 billion in a deal encouraged by regulators to help restore confidence in the global banking system.
These rapidly unfolding events have led to an environment where the Fed — unquestionably planning to hike rates just two weeks ago — is now tempering its hawkish tone and may even start cutting rates before the end of the year.
On Wednesday, the Fed increased its key policy rate by 25 basis points, but central bank officials omitted language from previous policy statements referring to the need for “ongoing” rate increases. Moreover, a rapid decline in bond yields over the past two weeks means investors expect the Fed to cut rates as expectations for economic growth and inflation fall, says fixed income portfolio manager Pramod Atluri.
The dislocations we are seeing in the financial markets signal a painful new phase for the Fed,” Atluri says. “We knew there would be consequences to one of the most aggressive tightening campaigns in history. It has clearly exposed some vulnerabilities in the banking system and, as a result, we may be nearing the end of the rate hikes.
SVB collapse has drastically altered interest rate expectations
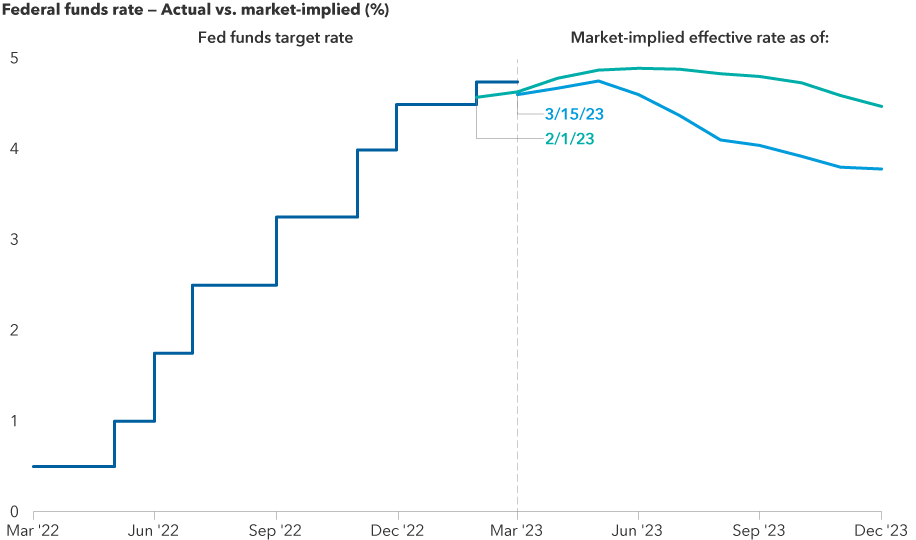
Sources: Capital Group, Bloomberg Index Services Ltd., Refinitiv Datastream, U.S. Federal Reserve. Fed funds target rate reflects the upper bound of the Federal Open Markets Committee's (FOMC) target range for overnight lending among U.S. banks. As of intraday, March 15, 2023.
In contrast, the Bank of Canada (BoC) has already paused interest rate hikes and held the target rate at 4.50% during its last monetary policy meeting March 8. Although that decision came in advance of Silicon Valley Bank’s demise and the subsequent U.S. and European banking sector turmoil, the BoC can take comfort from knowing the country’s domestic banking sector is well-capitalized and stable. There hasn’t been, in fact, a major bank failure in Canada since the collapse of Home Bank of Canada in 1923, and the country’s banking sector relatively breezed through the Great Financial Crisis in 2007-2008.
Recession risk on the rise
If investors were expecting a recession this year — and many were— adding a banking crisis into the mix considerably darkens the outlook, says Capital Group economist Jared Franz.
One reason bond yields are falling so quickly is that market participants are now predicting a recession more vociferously than before SVB’s troubles emerged. One strong indicator of that is an inverted yield curve — where the yield on short-term U.S. Treasury bonds is higher than the yield on longer dated bonds.
“That’s the most reliable recession indicator we have,” Franz explains.
Inverted yield curve warns of recession risk
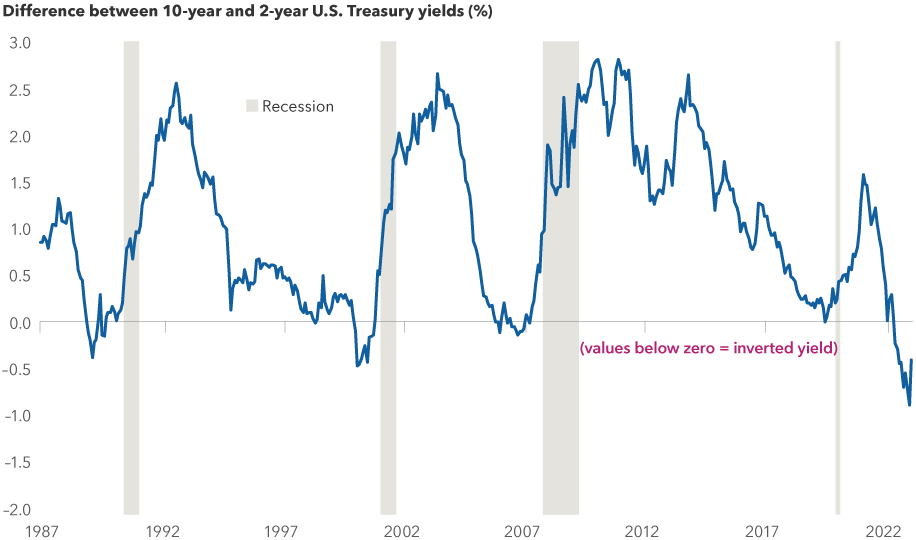
Sources: Capital Group, Bloomberg Index Services Ltd. As of intraday, March 15, 2023.
Recessions with a banking sector component are generally worse, on average, than more typical downturns, Franz says. That’s because banks will generally tighten lending standards, which then has a knock-on effect for the rest of the economy as it becomes harder for companies and individuals to get financing. Consumer spending and hiring are also likely to be impacted, he adds, as people save more money and companies announce layoffs.
Franz expects U.S. gross domestic product to decline by roughly 1.5% to 2.0% for the full year, compared to a previously expected decline of 1.0%. “That would still be well below the recessionary pain felt during the global financial crisis from 2007 to 2009, when GDP fell 4.3%, which this is clearly not,” Franz stresses.
What about inflation?
The challenge for the Fed is that inflation remains high. On a year-over-year basis, the U.S. Consumer Price Index stood at 6% in February, far above the Fed’s 2% target. That could put pressure on Fed officials to avoid cutting rates too soon. Instead, they may wait to see how much financial conditions tighten in the months ahead should additional turmoil unfold in the banking sector or elsewhere.
“The Fed still has a battle against inflation they need to wage,” Franz explains. “Ironically, the failure of SVB may help Fed officials accomplish their goal of contracting financial conditions so demand falls alongside inflationary pressures.
“We’re only two weeks into this situation, so it’s tough to say how it will ultimately play out. A lot depends on the regulatory response and whether the contagion spreads to other banks. It’s a fluid situation, and I don’t think anybody has all the answers, but hopefully we are asking the right questions.”
In Canada, the headline annual inflation rate fell to 5.2% in February from 5.9% in January. A similar, but smaller downward move was also evident in core inflation which eased to 4.9% in February from 5.0% the previous month. Canadian inflation numbers have fallen faster and lower due to the Canadian economy’s greater sensitivity to interest rate increases. This is due, in part, to higher levels of household debt in Canada as well as higher numbers of homeowners with short-duration mortgages which have to be renewed at what are now higher interest rates. An ongoing BoC pause is not a foregone conclusion, however, and the bank reiterated its commitment to price stability March 8, noting that its Governing Council “is prepared to increase the policy rate further if needed to return inflation to the 2% target.”
Troubled banks? We’ve been here before
Will Robbins, a Capital Group portfolio manager and former banking analyst, remains confident that the overall health of the U.S. banking system is strong. He believes it will simply take time for the turbulence to subside. Regulators have acted swiftly to contain the panic among regional bank investors, he notes, and larger banks have stepped in to help fund the rescue efforts.
“We’ve been here before,” says Robbins, who has covered the banking industry for more than 30 years. “This is an old-fashioned bank run. It’s going to be messy, and it’s going to take a while to sort things out. But I think we are well positioned to get through it.”
Going forward, Robbins expects to see several actions following SVB’s collapse, including a dramatic tightening of lending standards, stricter regulations for small- and mid-sized banks, and a resulting pressure on their ability to generate healthy profits.
“Longer term, I do think the earnings power of smaller banks will be impaired as a result of falling under the same regulatory regime that large banks were subjected to following the financial crisis,” Robbins says. Those included higher capital and liquidity requirements, periodic stress testing and restrictions on the types of investments banks can employ in their bond portfolios. In general, banks with less than $250 billion in assets have been exempt from such regulations.
Troubled banks have not, in contrast, been a problem in Canada since the previously mentioned collapse of Home Bank in 1923. After the bank failed, the country’s modern banking system was created including deposit insurance, federal regulatory oversight and a concentrated, virtual oligopoly of a handful of banks. One potential, noteworthy change that may come from Silicon Valley Bank’s demise is a possible increase in deposit insurance. It currently stands at $100,000 and the federal government has indicated it may raise the limit if troubles persist or worsen.
Regional banks are under the microscope following SVB collapse
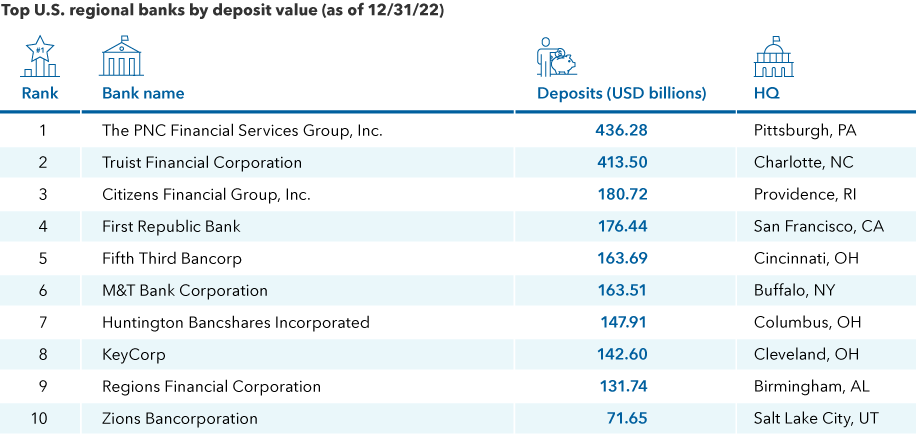
Sources: Capital Group, FactSet. Deposit values as of 12/31/2022.
Events are rapidly unfolding, Robbins cautions, so it will be important for investors to continue monitoring the situation.
“Central banks have moved swiftly to try and contain the spread of contagion across the financial system,” Robbins says. “We are still in the thick of it, so we cannot predict the path this will ultimately take.”
Is ‘Too Big to Fail’ now a positive?
As with any crisis, this one also presents potential investment opportunities, especially for investors with a long-term horizon.
Large U.S. banks, for instance, are already seeing a massive inflow of deposits as customers switch from regional institutions to the perceived safety of the big four: JPMorgan Chase, Bank of America, Citigroup and Wells Fargo.
Likewise, other large companies with strong balance sheets and the ability to fund their own growth should benefit, relatively speaking, from an environment in which it becomes tougher to access capital markets. Big technology and consumer tech companies from Apple to Amazon could once again find themselves the centre of attention if interest rates move significantly lower.
“These are the same companies that did poorly when rates were going up,” Robbins explains. “Now there’s an argument to be made that they are still growing in a low-growth environment. They don’t need access to capital to grow. And in many cases they already funded their major capital investments at a time when the cost of capital was much lower.
“So if there’s an expectation that rates are going down, or at least they aren’t going as high as previously thought,” he continues, “growth-oriented companies could be seen as more valuable, particularly the incumbents that funded their growth years ago.”
The U.S. Consumer Price Index (CPI) is a measure of the average change over time in the prices paid by urban U.S. consumers for a market basket of consumer goods and services.
Our latest insights
-
-
Global Equities
-
Artificial Intelligence
-
Technology & Innovation
-
RELATED INSIGHTS
-
-
Technology & Innovation
-
Global Equities
Commissions, trailing commissions, management fees and expenses all may be associated with mutual fund investments. Please read the prospectus before investing. Mutual funds are not guaranteed, their values change frequently and past performance may not be repeated.
Unless otherwise indicated, the investment professionals featured do not manage Capital Group‘s Canadian mutual funds.
References to particular companies or securities, if any, are included for informational or illustrative purposes only and should not be considered as an endorsement by Capital Group. Views expressed regarding a particular company, security, industry or market sector should not be considered an indication of trading intent of any investment funds or current holdings of any investment funds. These views should not be considered as investment advice nor should they be considered a recommendation to buy or sell.
Statements attributed to an individual represent the opinions of that individual as of the date published and do not necessarily reflect the opinions of Capital Group or its affiliates. This information is intended to highlight issues and not be comprehensive or to provide advice. For informational purposes only; not intended to provide tax, legal or financial advice. We assume no liability for any inaccurate, delayed or incomplete information, nor for any actions taken in reliance thereon. The information contained herein has been supplied without verification by us and may be subject to change. Capital Group funds are available in Canada through registered dealers. For more information, please consult your financial and tax advisors for your individual situation.
Forward-looking statements are not guarantees of future performance, and actual events and results could differ materially from those expressed or implied in any forward-looking statements made herein. We encourage you to consider these and other factors carefully before making any investment decisions and we urge you to avoid placing undue reliance on forward-looking statements.
The S&P 500 Composite Index (“Index”) is a product of S&P Dow Jones Indices LLC and/or its affiliates and has been licensed for use by Capital Group. Copyright © 2024 S&P Dow Jones Indices LLC, a division of S&P Global, and/or its affiliates. All rights reserved. Redistribution or reproduction in whole or in part are prohibited without written permission of S&P Dow Jones Indices LLC.
FTSE source: London Stock Exchange Group plc and its group undertakings (collectively, the "LSE Group"). © LSE Group 2024. FTSE Russell is a trading name of certain of the LSE Group companies. "FTSE®" is a trade mark of the relevant LSE Group companies and is used by any other LSE Group company under licence. All rights in the FTSE Russell indices or data vest in the relevant LSE Group company which owns the index or the data. Neither LSE Group nor its licensors accept any liability for any errors or omissions in the indices or data and no party may rely on any indices or data contained in this communication. No further distribution of data from the LSE Group is permitted without the relevant LSE Group company's express written consent. The LSE Group does not promote, sponsor or endorse the content of this communication. The index is unmanaged and cannot be invested in directly.
BLOOMBERG® is a trademark and service mark of Bloomberg Finance L.P. and its affiliates (collectively “Bloomberg”). Bloomberg or Bloomberg’s licensors own all proprietary rights in the Bloomberg Indices. Neither Bloomberg nor Bloomberg’s licensors approves or endorses this material, or guarantees the accuracy or completeness of any information herein, or makes any warranty, express or implied, as to the results to be obtained therefrom and, to the maximum extent allowed by law, neither shall have any liability or responsibility for injury or damages arising in connection therewith.
MSCI does not approve, review or produce reports published on this site, makes no express or implied warranties or representations and is not liable whatsoever for any data represented. You may not redistribute MSCI data or use it as a basis for other indices or investment products.
Capital believes the software and information from FactSet to be reliable. However, Capital cannot be responsible for inaccuracies, incomplete information or updating of the information furnished by FactSet. The information provided in this report is meant to give you an approximate account of the fund/manager's characteristics for the specified date. This information is not indicative of future Capital investment decisions and is not used as part of our investment decision-making process.
Indices are unmanaged and cannot be invested in directly. Returns represent past performance, are not a guarantee of future performance, and are not indicative of any specific investment.
All Capital Group trademarks are owned by The Capital Group Companies, Inc. or an affiliated company in Canada, the U.S. and other countries. All other company names mentioned are the property of their respective companies.
Capital Group funds are offered in Canada by Capital International Asset Management (Canada), Inc., part of Capital Group, a global investment management firm originating in Los Angeles, California in 1931. Capital Group manages equity assets through three investment groups. These groups make investment and proxy voting decisions independently. Fixed income investment professionals provide fixed income research and investment management across the Capital organization; however, for securities with equity characteristics, they act solely on behalf of one of the three equity investment groups.
The Capital Group funds offered on this website are available only to Canadian residents.