Asset Allocation
 Mike Gitlin
To say this has been an interesting year in financial markets is an understatement. Equities have been stronger than most expected, and the 10-year U.S. Treasury yield is up 37 basis points as of September 13. So where are we now as we head into the homestretch of 2023? I believe we’re on the cusp of a major transition, one where long-term investors can find attractive income opportunities as central banks pivot from restrictive monetary policy to something that looks much more benign.
Last year was shocking to many in the investment community: It marked the first time in at least 45 years that both stocks and bonds posted negative returns in a calendar year. Battling high inflation, the U.S. Federal Reserve raised interest rates aggressively. Those hikes hurt absolute results across the board. The usual role of high-quality bonds to provide diversification from stock market volatility — something investors rely on — broke down.
Most investors had never faced a year as challenging as 2022
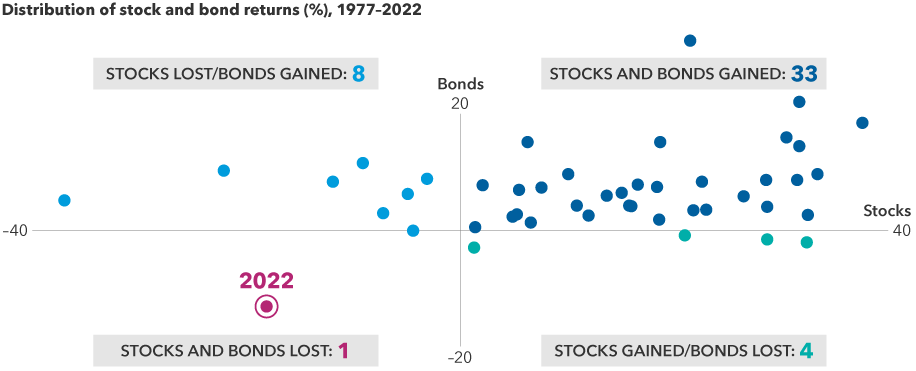
Sources: Capital Group, Bloomberg Index Services Ltd., Standard & Poor's. Each dot represents an annual stock and bond market return from 1977 through 2022. Stock returns represented by the S&P 500 Index. Bond returns represented by the Bloomberg U.S. Aggregate Index. Past results are not predictive of results in future periods. Returns are in USD.
Turbulent markets in 2022, plus the prospect of relatively high yields in money markets, led investors to flock to cash-like alternatives. Money market funds were at an all-time high of US$5.6 trillion as of September 6, according to the Investment Company Institute. Cash investments still look compelling to many investors today, but the Fed appears to be nearing a turning point. History teaches us that this may be an opportune time to shift back to stocks and bonds.
Will the Fed raise interest rates again?
Nobody knows exactly when the Fed will stop raising rates. However, both markets and the Fed itself project its key policy rate to peak near current levels and then decline around 100 basis points by the end of 2024.
Both the market and Fed project lower rates in 2024
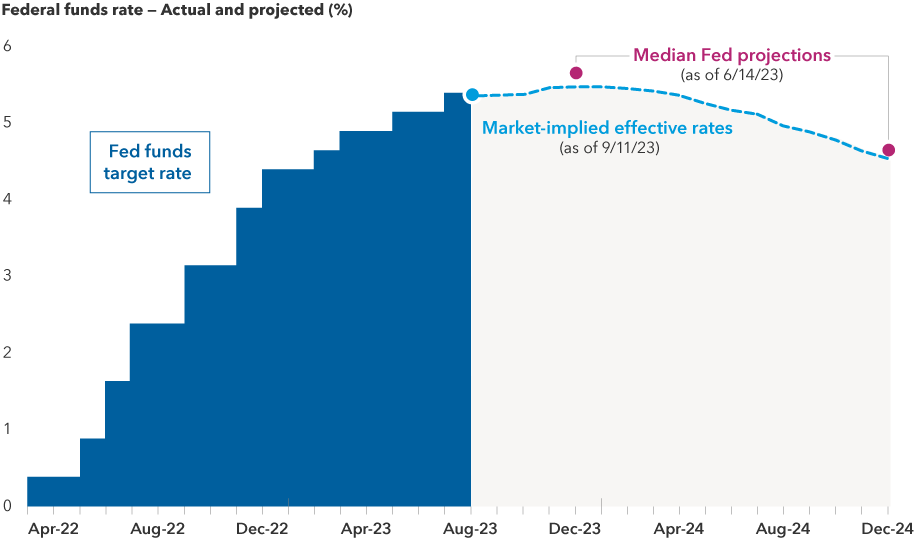
Sources: Bloomberg, Federal Reserve. The fed fund target rate shown is the midpoint of the 50 basis-point range that the Federal Reserve aims for in setting its policy interest rate. Market-implied effective rates are a measure of what the fed funds rate could be in the future and are calculated using fed fund rate futures market data.
If you believe the Fed is finished or nearly there, what does history tell us? An analysis of the end of the last four Fed hiking cycles shows that cash investments decayed while stocks and bonds flourished.
History shows cash has decayed when Fed hikes end
Sitting in money market funds today may feel comfortable with a roughly 5% yield, based on the benchmark 3-month Treasury, especially after an extended period of experimental zero interest rate policy post-global financial crisis. But the benefit of remaining in cash at current yields is eroded by today’s moderate inflation. Additionally, these cash-like holdings may see little additional upside as the Fed finishes hiking rates.
There is where the math matters. History shows that in the 18 months after the Fed ended hikes in the last four cycles, yields on cash-like investments have traditionally decayed rapidly. The 3-month U.S. Treasury yield, a benchmark Treasury security with a yield similar to cash-like investments, fell an average of 2.5%. If history were to repeat itself, money market fund yields would decline, and investors would be better served by being actively invested in stocks and bonds.
3-month T-bill yields declined sharply following the Fed’s final hike in the last four cycles
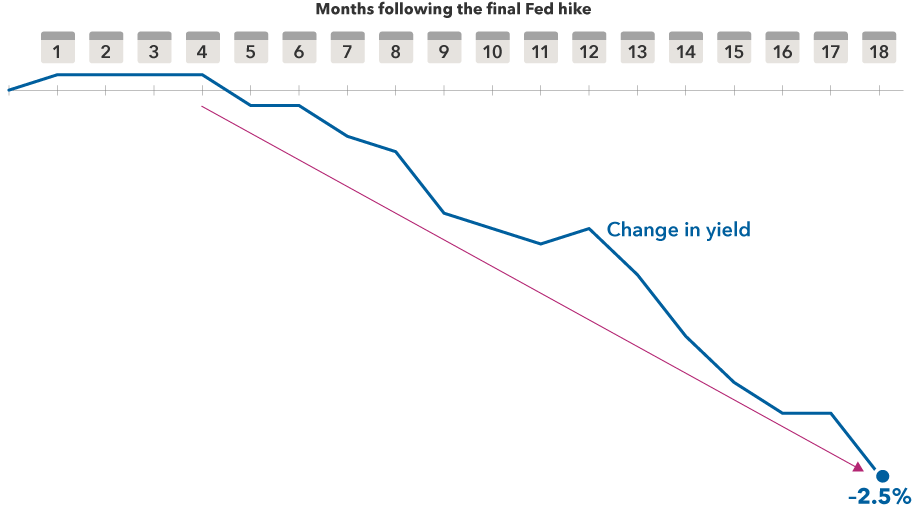
Sources: Bloomberg, Federal Reserve. As of 6/30/23. Chart represents the average decline in 3-month Treasury bills starting in the month of the last Fed hike in the last four transition cycles from 1995 to 2018. Past results are not predictive of results in future periods.
Where to invest cash today
If you agree that the Fed is nearly finished hiking and that cash yields may decline over time, the question is: Where to invest today? After the Fed’s final hike in the last four cycles, both equity and fixed income returns were strong in the year that followed. Importantly, for long-term investors, these sectors maintained relative strength over a five-year period.
After Fed hikes ended, long-term results outpaced cash, with the first year contributing most
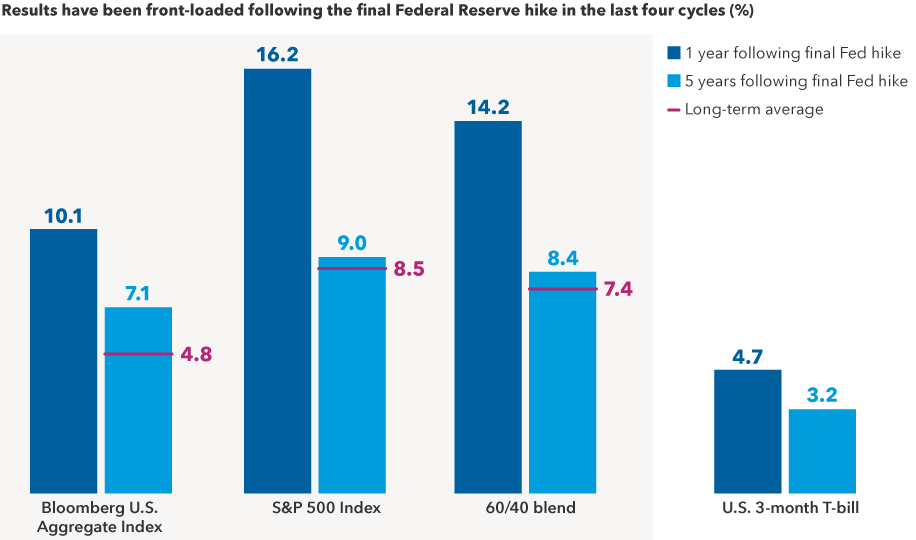
Sources: Capital Group, Morningstar. Chart represents the average returns across respective sector proxies in a forward extending window starting in the month of the last Fed hike in the last four transition cycles from 1995 to 2018 with data through 6/30/23. The 60/40 blend represents 60% S&P 500 Index and 40% Bloomberg U.S. Aggregate Bond Index, rebalanced monthly. Long-term averages represented by the average five-year annualized rolling returns from 1995. Past results are not predictive of results in future periods. Returns are in USD.
Today, fixed income is living up to its name again by providing solid income potential to investors. The Bloomberg U.S. Bond Aggregate Index, a popular benchmark for high-quality core bond funds, had a yield-to-worst (the lowest possible yield that can be received on a bond that fully operates within the terms of its contract without defaulting) of 5.0% at the end of August. That’s roughly double its 10-year average, as highly accommodative policy weighed on yields during the past decade. This income potential today provides a solid starting point for total return.
The same exposure to interest rates that hurt bonds in 2022 would benefit bonds if rates begin to fall. Here’s a hypothetical example of how that could work. The index’s duration, a measure of interest rate sensitivity, is 6.25 years. That means if yields decline by nearly 100 basis points in 2024, investors could see upside of 6.25% in positive price return, all else being equal. Together, those income and price return components would equate to a hypothetical one-year return that could venture into double digits, assuming credit doesn’t deteriorate meaningfully. Under that same scenario, money market fund yields would drop below 5%.
For stocks, when the Fed stops tightening policy, one risk for the financial system dissipates. And as companies and consumers see their borrowing costs stabilize and eventually begin to decline, it provides a boost to the economy and corporate profits. Historically, equity investors have seen the benefit.
At this time, a balanced strategy could also be attractive for more cautious investors. A balanced portfolio tends to hold more defensive positions in dividend-paying stocks and high-quality bonds. And if the economy slows or falls into recession, it could provide some resilience.
It takes courage to take action
Inertia can be a very powerful force, especially 5% cash yield-induced inertia. Investor emotions are real. Past losses sting for a long time, and today’s seemingly attractive rates on certificates of deposit in the U.S. and in money markets feel good. But as investors, we know that markets don’t idle for long. Investors could become stuck in cash if they wait too long to get back into the market, as better potential opportunities emerge.
At Capital Group, we focus on helping investors achieve long-term success . I firmly believe that the best path toward that goal is through stock and bond markets. Our analysts and portfolio managers are scouring the world to find new investment ideas, regardless of market ups and downs. We’re optimistic about what the future has in store and committed to improving people’s lives through successful investing.
Bloomberg U.S. Aggregate Bond Index represents the U.S. investment-grade (BBB-Baa) fixed-rate bond market.
S&P 500 Index is a market capitalization-weighted index based on the results of approximately 500 widely held common stocks.
The 60%/40% S&P 500 Index/Bloomberg U.S. Aggregate Bond Index blends the S&P 500 with the Bloomberg U.S. Aggregate Index by weighting their cumulative total returns at 60% and 40%, respectively. This assumes the blend is rebalanced monthly.
© 2023 Morningstar, Inc. All rights reserved. The information contained herein: (1) is proprietary to Morningstar and/or its content providers; (2) may not be copied or distributed; and (3) is not warranted to be accurate, complete or timely. Neither Morningstar nor its content providers are responsible for any damages or losses arising from any use of this information.
Our latest insights
-
-
Global Equities
-
Artificial Intelligence
-
Technology & Innovation
-
RELATED INSIGHTS
-
Asset Allocation
-
Markets & Economy
-
Long-Term Investing
Commissions, trailing commissions, management fees and expenses all may be associated with mutual fund investments. Please read the prospectus before investing. Mutual funds are not guaranteed, their values change frequently and past performance may not be repeated.
Unless otherwise indicated, the investment professionals featured do not manage Capital Group‘s Canadian mutual funds.
References to particular companies or securities, if any, are included for informational or illustrative purposes only and should not be considered as an endorsement by Capital Group. Views expressed regarding a particular company, security, industry or market sector should not be considered an indication of trading intent of any investment funds or current holdings of any investment funds. These views should not be considered as investment advice nor should they be considered a recommendation to buy or sell.
Statements attributed to an individual represent the opinions of that individual as of the date published and do not necessarily reflect the opinions of Capital Group or its affiliates. This information is intended to highlight issues and not be comprehensive or to provide advice. For informational purposes only; not intended to provide tax, legal or financial advice. We assume no liability for any inaccurate, delayed or incomplete information, nor for any actions taken in reliance thereon. The information contained herein has been supplied without verification by us and may be subject to change. Capital Group funds are available in Canada through registered dealers. For more information, please consult your financial and tax advisors for your individual situation.
Forward-looking statements are not guarantees of future performance, and actual events and results could differ materially from those expressed or implied in any forward-looking statements made herein. We encourage you to consider these and other factors carefully before making any investment decisions and we urge you to avoid placing undue reliance on forward-looking statements.
The S&P 500 Composite Index (“Index”) is a product of S&P Dow Jones Indices LLC and/or its affiliates and has been licensed for use by Capital Group. Copyright © 2024 S&P Dow Jones Indices LLC, a division of S&P Global, and/or its affiliates. All rights reserved. Redistribution or reproduction in whole or in part are prohibited without written permission of S&P Dow Jones Indices LLC.
FTSE source: London Stock Exchange Group plc and its group undertakings (collectively, the "LSE Group"). © LSE Group 2024. FTSE Russell is a trading name of certain of the LSE Group companies. "FTSE®" is a trade mark of the relevant LSE Group companies and is used by any other LSE Group company under licence. All rights in the FTSE Russell indices or data vest in the relevant LSE Group company which owns the index or the data. Neither LSE Group nor its licensors accept any liability for any errors or omissions in the indices or data and no party may rely on any indices or data contained in this communication. No further distribution of data from the LSE Group is permitted without the relevant LSE Group company's express written consent. The LSE Group does not promote, sponsor or endorse the content of this communication. The index is unmanaged and cannot be invested in directly.
BLOOMBERG® is a trademark and service mark of Bloomberg Finance L.P. and its affiliates (collectively “Bloomberg”). Bloomberg or Bloomberg’s licensors own all proprietary rights in the Bloomberg Indices. Neither Bloomberg nor Bloomberg’s licensors approves or endorses this material, or guarantees the accuracy or completeness of any information herein, or makes any warranty, express or implied, as to the results to be obtained therefrom and, to the maximum extent allowed by law, neither shall have any liability or responsibility for injury or damages arising in connection therewith.
MSCI does not approve, review or produce reports published on this site, makes no express or implied warranties or representations and is not liable whatsoever for any data represented. You may not redistribute MSCI data or use it as a basis for other indices or investment products.
Capital believes the software and information from FactSet to be reliable. However, Capital cannot be responsible for inaccuracies, incomplete information or updating of the information furnished by FactSet. The information provided in this report is meant to give you an approximate account of the fund/manager's characteristics for the specified date. This information is not indicative of future Capital investment decisions and is not used as part of our investment decision-making process.
Indices are unmanaged and cannot be invested in directly. Returns represent past performance, are not a guarantee of future performance, and are not indicative of any specific investment.
All Capital Group trademarks are owned by The Capital Group Companies, Inc. or an affiliated company in Canada, the U.S. and other countries. All other company names mentioned are the property of their respective companies.
Capital Group funds are offered in Canada by Capital International Asset Management (Canada), Inc., part of Capital Group, a global investment management firm originating in Los Angeles, California in 1931. Capital Group manages equity assets through three investment groups. These groups make investment and proxy voting decisions independently. Fixed income investment professionals provide fixed income research and investment management across the Capital organization; however, for securities with equity characteristics, they act solely on behalf of one of the three equity investment groups.
The Capital Group funds offered on this website are available only to Canadian residents.