Election
 Matt Miller
 Clarke Camper
 Reagan Anderson
Heading into 2020, there was little doubt that the U.S. presidential election would be the biggest story of the year. The coronavirus pandemic drastically changed that narrative, pushing the election aside as a health care crisis triggered the worst economic downturn since the Great Depression.
With the election now less than 100 days away, however, investors are turning their attention back to the November 3 ballot. Amid rising COVID-19 infections, a battered economy and civil unrest in several U.S. cities, President Donald Trump is trailing former Vice President Joe Biden by a wide margin in major polls.
Many pundits are predicting defeat for the president, but it’s far too early for investors to anchor on that outcome, says Capital Group veteran political economist Matt Miller.
“We have more than three months to go before the election. That’s a lifetime in politics,” Miller says. “Given the rapid pace of developments and a compressed news cycle, we could have many turns of the wheel between now and November. In my view, the race will tighten as the Republican and Democratic campaigns shift into overdrive.”
Election scenario planning
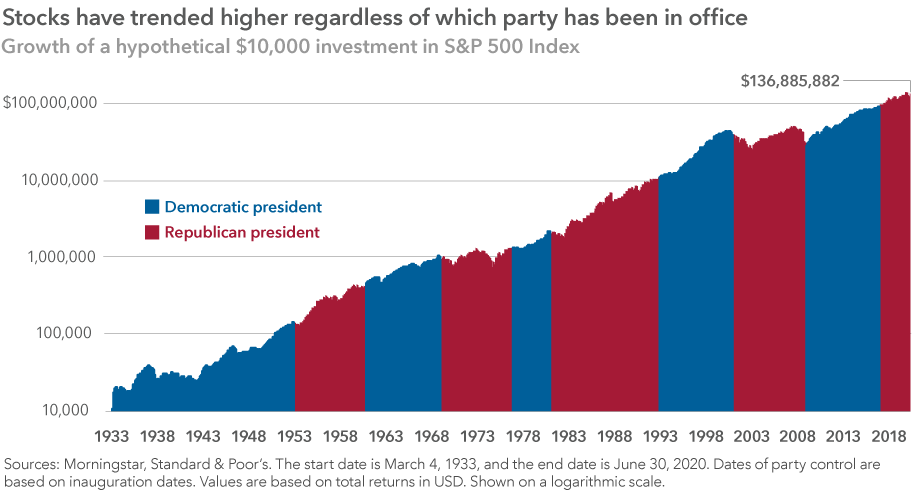
For long-term investors, the outcome of U.S. presidential elections hasn’t mattered as much as staying invested and maintaining a diversified portfolio. Markets have tended to power through presidential elections — with some volatility along the way — regardless of whether a Democrat or Republican won the White House.
That said, election scenario planning plays a role in macroeconomic analysis, particularly in recent years as governments have increasingly intervened in the financial markets during times of crisis.
Excluding a contested election — which is certainly within the realm of possibility — here’s a brief look at four scenarios that could play out in November and potential implications for investors.
Scenario 1: Democratic sweep
Democrats win the White House, the Senate and maintain control of the House — otherwise known as a “blue wave.” This scenario would produce the greatest degree of political change, starting with the likely reversal of Trump’s policy agenda on many fronts, including taxes, immigration and regulation.
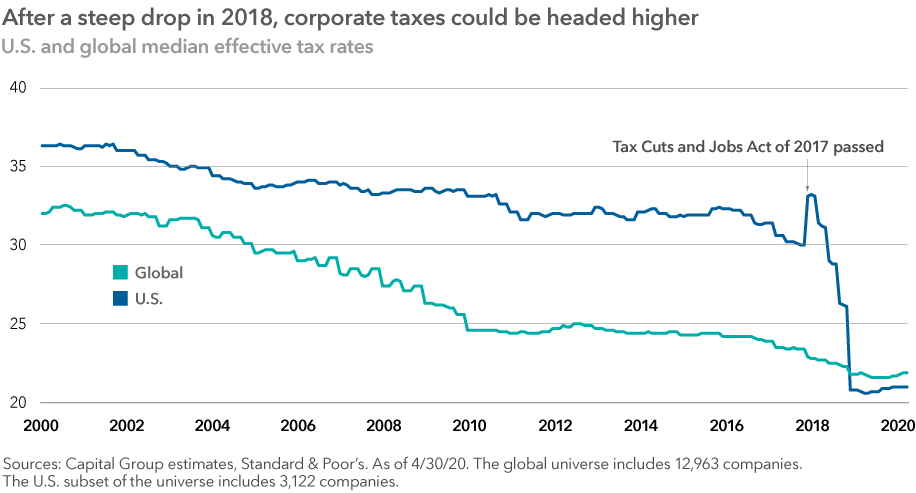
One result could be a full or partial rollback of the Tax Cuts and Jobs Act of 2017, which included significant tax reductions. Overall U.S. corporate tax rates declined from 35% to 21%, providing a major boost to corporate earnings. A full or partial reversal would have the opposite effect, prompting investors to take that into account when estimating the overall corporate earnings outlook.
“We would see a much bigger emphasis on taxation and regulation across the board, with significant implications for the energy sector, telecommunications and technology companies,” Miller explains. “We could also see the elimination of the filibuster in the Senate, which, unlike today, would allow legislation to pass with a simple majority vote.”
Scenario 2: Gridlock
Biden wins the White House; Republicans maintain control of the Senate. This outcome would likely result in a gridlock scenario where it could be difficult to pass major legislation. Senate Republicans could block major Democratic initiatives, much as they did during the second term of the Obama presidency.
“In this case, I think we would see Biden governing through executive orders,” says Clarke Camper, head of government relations in Capital Group’s Washington, D.C. office. “There would be a great deal of pent-up frustration on both sides of the aisle. That’s an easy outcome to predict, though, perhaps not as easy to live with.”
Under this scenario, federal regulatory agencies would also likely exercise more power. From a financial markets perspective, that could mean more aggressive enforcement by the Securities and Exchange Commission, as well as a renewed policy push by the Department of Labor in connection with its oversight of employee retirement plans.
Scenario 3: Status quo
Trump wins reelection, and Republicans keep the Senate. This scenario involves the least amount of change since it is, indeed, where we are today. The House is likely to remain in Democratic hands, so the current environment of political confrontation would continue — along with the rancorous attempts to approve COVID-19 relief legislation, including the US$2 trillion CARES Act.
“Regardless of who is in the White House in January, there's going to be a lot of post-COVID cleanup work to do,” explains Reagan Anderson, a senior vice president with Capital’s government relations team. “Today we are in stabilization mode, and we will hopefully be moving into recovery mode by 2021.”
Scenario 4: Unlikely split
Trump wins reelection, and Democrats take the Senate. This scenario could set the stage for even greater hostility than we’ve seen in the past two years. While such an outcome is theoretically possible, it’s unlikely given the political dynamics of key Senate races, which increasingly track the presidential vote in each state.
“For instance, if Republicans lose key Senate races in Arizona, Colorado, Maine and North Carolina, then that’s clearly indicative of a ‘blue wave,’” Miller explains. “It’s hard to imagine Trump winning the White House if that happens.”
Either scenario involving Trump’s reelection raises another risk: If he wins without a majority of the popular vote as he did in 2016, Miller warns, that could lead to more civil unrest and further demands to abolish the Electoral College.
Investment implications
Election season can be a tough time for investors to maintain a long-term perspective, given the strong emotions often evoked by politics. Campaign rhetoric tends to amplify negative and divisive issues. This election, in particular, is unprecedented in modern times — marked by the combination of a deadly pandemic, a global economic recession, widespread civil unrest and extreme market volatility.
Moving to the sidelines would be an understandable approach for anxious investors who prefer to wait and see what happens. As history has shown, however, that is often a mistake. What matters most is not election results, but staying invested.
Consider the historical performance of the Standard & Poor’s 500 Composite Index over the past eight decades. In 18 of 19 presidential elections, a hypothetical US$10,000 investment made at the beginning of each election year would have gained value 10 years later. That’s regardless of which party’s candidate won. In 15 of those 10-year periods, a US $10,000 investment would have more than doubled. While past results do not guarantee future returns, election-year jitters should not deter investors from maintaining a long-term perspective.
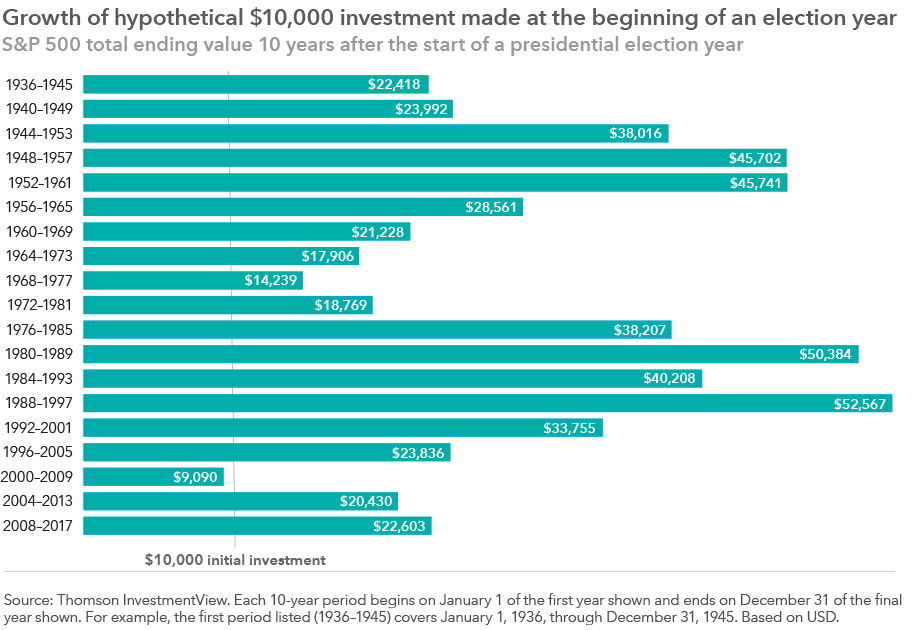
The only negative 10-year period followed the election of George W. Bush in the year 2000. During that decade, the S&P 500 posted a negative return amid two seismic events: the 2000 dot-com crash and 2008 global financial crisis.
In contrast, the biggest election year return would have been in 1988, when George H. W. Bush won office, and US $10,000 would have grown to US $52,567 by the end of 1997.
By design, elections have winners and losers, but the real winners have been investors who stayed the course and avoided the temptation to time the market.
Our latest insights
-
-
Global Equities
-
Artificial Intelligence
-
Technology & Innovation
-
RELATED INSIGHTS
-
-
Artificial Intelligence
-
Technology & Innovation
Commissions, trailing commissions, management fees and expenses all may be associated with mutual fund investments. Please read the prospectus before investing. Mutual funds are not guaranteed, their values change frequently and past performance may not be repeated.
Unless otherwise indicated, the investment professionals featured do not manage Capital Group‘s Canadian mutual funds.
References to particular companies or securities, if any, are included for informational or illustrative purposes only and should not be considered as an endorsement by Capital Group. Views expressed regarding a particular company, security, industry or market sector should not be considered an indication of trading intent of any investment funds or current holdings of any investment funds. These views should not be considered as investment advice nor should they be considered a recommendation to buy or sell.
Statements attributed to an individual represent the opinions of that individual as of the date published and do not necessarily reflect the opinions of Capital Group or its affiliates. This information is intended to highlight issues and not be comprehensive or to provide advice. For informational purposes only; not intended to provide tax, legal or financial advice. We assume no liability for any inaccurate, delayed or incomplete information, nor for any actions taken in reliance thereon. The information contained herein has been supplied without verification by us and may be subject to change. Capital Group funds are available in Canada through registered dealers. For more information, please consult your financial and tax advisors for your individual situation.
Forward-looking statements are not guarantees of future performance, and actual events and results could differ materially from those expressed or implied in any forward-looking statements made herein. We encourage you to consider these and other factors carefully before making any investment decisions and we urge you to avoid placing undue reliance on forward-looking statements.
The S&P 500 Composite Index (“Index”) is a product of S&P Dow Jones Indices LLC and/or its affiliates and has been licensed for use by Capital Group. Copyright © 2024 S&P Dow Jones Indices LLC, a division of S&P Global, and/or its affiliates. All rights reserved. Redistribution or reproduction in whole or in part are prohibited without written permission of S&P Dow Jones Indices LLC.
FTSE source: London Stock Exchange Group plc and its group undertakings (collectively, the "LSE Group"). © LSE Group 2024. FTSE Russell is a trading name of certain of the LSE Group companies. "FTSE®" is a trade mark of the relevant LSE Group companies and is used by any other LSE Group company under licence. All rights in the FTSE Russell indices or data vest in the relevant LSE Group company which owns the index or the data. Neither LSE Group nor its licensors accept any liability for any errors or omissions in the indices or data and no party may rely on any indices or data contained in this communication. No further distribution of data from the LSE Group is permitted without the relevant LSE Group company's express written consent. The LSE Group does not promote, sponsor or endorse the content of this communication. The index is unmanaged and cannot be invested in directly.
BLOOMBERG® is a trademark and service mark of Bloomberg Finance L.P. and its affiliates (collectively “Bloomberg”). Bloomberg or Bloomberg’s licensors own all proprietary rights in the Bloomberg Indices. Neither Bloomberg nor Bloomberg’s licensors approves or endorses this material, or guarantees the accuracy or completeness of any information herein, or makes any warranty, express or implied, as to the results to be obtained therefrom and, to the maximum extent allowed by law, neither shall have any liability or responsibility for injury or damages arising in connection therewith.
MSCI does not approve, review or produce reports published on this site, makes no express or implied warranties or representations and is not liable whatsoever for any data represented. You may not redistribute MSCI data or use it as a basis for other indices or investment products.
Capital believes the software and information from FactSet to be reliable. However, Capital cannot be responsible for inaccuracies, incomplete information or updating of the information furnished by FactSet. The information provided in this report is meant to give you an approximate account of the fund/manager's characteristics for the specified date. This information is not indicative of future Capital investment decisions and is not used as part of our investment decision-making process.
Indices are unmanaged and cannot be invested in directly. Returns represent past performance, are not a guarantee of future performance, and are not indicative of any specific investment.
All Capital Group trademarks are owned by The Capital Group Companies, Inc. or an affiliated company in Canada, the U.S. and other countries. All other company names mentioned are the property of their respective companies.
Capital Group funds are offered in Canada by Capital International Asset Management (Canada), Inc., part of Capital Group, a global investment management firm originating in Los Angeles, California in 1931. Capital Group manages equity assets through three investment groups. These groups make investment and proxy voting decisions independently. Fixed income investment professionals provide fixed income research and investment management across the Capital organization; however, for securities with equity characteristics, they act solely on behalf of one of the three equity investment groups.
The Capital Group funds offered on this website are available only to Canadian residents.