Bonds
 Oliver Edmonds
 Tom Chow
 Vikas Malhotra
- The U.S. Federal Reserve is likely done raising interest rates, which has historically been a good time to own bonds
- Rate cuts could happen in 2024 if inflation falls closer to target and the economy slows
- Yields are near 20-year highs across credit sectors, offering higher income potential
Falling inflation alongside a cooling economy has bond investors feeling relieved: The Federal Reserve may finally be done lifting interest rates. And with yields across bond markets near 20-year highs, bonds could be the comeback story of 2024.
Investors have been here before — only for the central bank to continue to raise rates as inflation didn’t slow quickly enough. “The difference this time compared to the past year is a combination of inflation falling much closer to target and many more data points showing that high interest rates are taking a toll on the economy,” says fixed income portfolio manager Oliver Edmonds.
Fed hikes have lifted yields across bond sectors

Sources: Capital Group, Bloomberg Index Services Ltd., J.P. Morgan. Indices used are the Bloomberg Global Aggregate Bond (global aggregate), Bloomberg U.S. MBS: Agency Fixed Rate MBS Index (U.S. mortgage-backed securities), Bloomberg U.S. Corporate Investment Grade Index (U.S. investment grade), Bloomberg U.S. High Yield 2% Issuer Cap Index (U.S. high yield) and the J.P. Morgan EMBI Global Diversified Index (emerging markets). As of November 30, 2023.
The Fed has kept rates steady for several months after raising them since March 2022 to the current range of 5.25% to 5.50%. Officials signaled three rate cuts and intend to lower borrowing costs to 4.6% by the end of 2024.
Meanwhile, employment and consumer spending have remained surprisingly resilient. The U.S. unemployment rate hovered at 3.7% in November, with 199,000 jobs added. That rate is above the 50-year low of 3.4% that the U.S. hit in April 2023.
“The lifeblood of the economy is the consumer, who is supported by full employment. Once you see employment figures declining past a certain point,” Edmonds adds, “it can easily spiral, and you can end up in a situation where the Fed has overtightened.”
That point — according to one recession indicator known as the Sahm rule — is when the three-month unemployment average is 0.5% point or more above its low in the prior 12 months. The current value is 0.3% point.
A positive outlook on interest rates
When the U.S. Treasury yield curve inverted — meaning short-term yields moved higher than long-term yields — in July 2022, many viewed it as an alarm bell for an imminent recession. More than a year on, a recession has not materialized, but it is still too early to tell whether the Fed managed to pull off a “soft landing,” believes Tim Ng, portfolio manager for Capital Group Canadian Core Plus Fixed Income FundTM (Canada).
Historically, the average time frame for a recession following an inverted yield curve has been about 15 months, with the longest interval being 24 months. Moreover, the Fed’s rate hikes will continue to be felt as they filter through the economy. In response to the uncertainty, bond markets have seesawed between the belief that the Fed will keep rates higher for an extended period and they will cut interest rates in 2024 to avoid deep economic damage.
Under both scenarios, investors may want to position for a normalization or steepening of the yield curve, where long-term Treasury yields are higher than short-term yields, says Ng, a member of Capital Group’s U.S. rates team. “The yield curve is likely to steepen in a recessionary environment and could also steepen in a higher-for-longer environment where short-term yields remain anchored while longer term yields rise.”
The inverted yield curve has started to normalize

Sources: Capital Group, Bloomberg Index Services Ltd., National Bureau of Economic Research, Refinitiv Datastream. As of November 30, 2023.
Current valuations may offer an attractive entry point as the interest rate outlook is more benign. “Further curve inversion is likely limited and would require a reacceleration of inflation, which we consider a low probability,” Ng adds.
Prices have declined for several categories in the U.S. Consumer Price Index (a measure of the average change over time in the prices paid by urban consumers for a market basket of consumer goods and services), including used cars and trucks, hotels and airfares. Meanwhile, fewer categories have outsized price increases. These trends should continue, while further loosening in labour markets may lead to a sustained cooling in wage growth. The Fed could feel less pressure to keep rates high and may lower its policy rate if it is perceived to be too restrictive given the level of inflation.
The point in the cycle when the Fed is done hiking rates has tended to be an attractive time to own duration, which measures a bond’s sensitivity to interest rates, and is a hallmark of bonds with longer maturities. “If you study the end of rates cycles in the U.S., these periods have been generally positive for fixed income and for duration,” Ng says.
Mortgages and investment-grade bonds offer compelling opportunities
Despite an uncertain economic outlook, high starting yields combined with a confluence of supportive factors currently underpin agency mortgage-backed securities (MBS) and investment-grade corporate bonds (rated BBB/Baa and above).
Over the past few years, there were periods when valuations for higher coupon mortgages were especially attractive, according to Edmonds. Most notably, the regional bank crisis early in 2023 caused yield spreads over Treasuries to dramatically widen before ultimately narrowing as it became clear the economy could withstand the shock of the crisis.
“The narrative for mortgages flipped from being unattractive to being attractive fairly quickly, so it’s about seizing opportunities as they arise,” Edmonds says.
Looking into 2024, the impact of a continued runoff of the Fed’s balance sheet may become a more prominent topic, as the central bank has been price insensitive and the largest buyer of mortgage securities over the last few years. Nevertheless, housing inventory and affordability remain near all-time lows, which will continue to reduce the supply of mortgage securities and, in turn, support valuations.
“As securities that carry an implicit government guarantee, agency MBS can be an outstanding way of adding income to a portfolio without taking credit risk that correlates with equities and other assets,” says fixed income portfolio manager David Betanzos.
Meanwhile, investment-grade corporate bonds are supported by strong balance sheets and low refinancing needs. In a modest growth environment, investors could earn the coupon payment without too much downside risk. If the economy slows and Treasury yields decline, the sector’s longer duration relative to other credit sectors such as high yield would mean potential price appreciation, which could offset any widening in spreads.
Overall, investment-grade corporate bonds can provide a solid middle ground for portfolios. If the Fed executes a ”soft landing“ and avoids a recession, investment-grade credit should fare well. And if there’s a recession, the drawdown, or peak-to-trough decline in returns, should be muted compared to what would be expected in other areas of credit, especially lower rated bonds.
Many investment-grade-rated companies won't face pressure to issue new debt until interest rates come down as they used the pandemic era’s low interest rate environment to lock in financing at attractive rates with long maturities. Therefore, supply will likely remain muted even as demand from investors such as pension funds, banks and insurance companies continues.
Healthy income potential in high yield
Amid the fuss about where rates are going, you could have easily missed the healthy returns that high-yield bonds posted in 2023. The lesson: High-yield bonds (rated BB/Ba and below) can offer powerful income potential.
Despite the risk of a decline in earnings growth and lower cash flows for many companies in 2024 — especially those with leveraged balance sheets — high-yield bonds have historically done well as long as economic growth remains positive. Even if spreads to Treasuries widen, with yields around 8.4%, the income component can be significant and result in positive returns.
The refinancing needs of many companies rated high yield have caught the attention of markets, but most don’t hit a “maturity wall” until 2026, says fixed income portfolio manager Tom Chow. Moreover, the overall credit profile of the high-yield sector has improved as companies with significant leverage have turned to private credit for funding.
“Investors have priced in an uptick in default rates to be in the 4% to 5% range in 2024,” explains Chow. “It really is about credit selection,” he adds, noting technology companies with high recurring revenues and large equity cushions are attractive in this environment. Chow is more selective about issuers rated CCC-and-below.
A balanced approach to emerging markets debt
Emerging market (EM) local currency bonds are less vulnerable to higher developed market rates than previously. Many EM economies have seen improving economic trends. “On balance, the fiscal deficits of several EM countries have narrowed to or below pre-pandemic levels,” says Kirstie Spence, portfolio manager for Capital Group Multi-Sector Income FundTM (Canada). Meanwhile, as inflation has been declining, EM central banks are starting to cut interest rates. Falling EM rates alongside decent fundamentals should support EM local currency bonds in 2024.
The hard currency, U.S. dollar-denominated bond market is divided between issuers rated investment-grade and high yield. Spreads on some higher yielding, lower credit quality EM bonds have trended wider, but are being driven by factors specific to each credit, requiring case-by-case analysis. Many investment-grade credits offer lower income but are supported by relatively strong fundamentals.
Spence favours a balanced approach to owning both hard and local currency issuers: A blended portfolio can benefit from the differentiated risk profiles and return drivers for each segment of the market. Historically, two-year forward returns have been positive when yields reached 6.7% or higher. High starting yields offer a buffer against any volatility that the global macroeconomic and geopolitical environment might bring in 2024.
Back to basics
The Fed is likely done with interest rate increases. While the economy has held up so far and inflation has fallen from its peak, the full effect of the tightening campaign is still being felt and the U.S. is not out of the woods.
Are high interest rates here to stay?
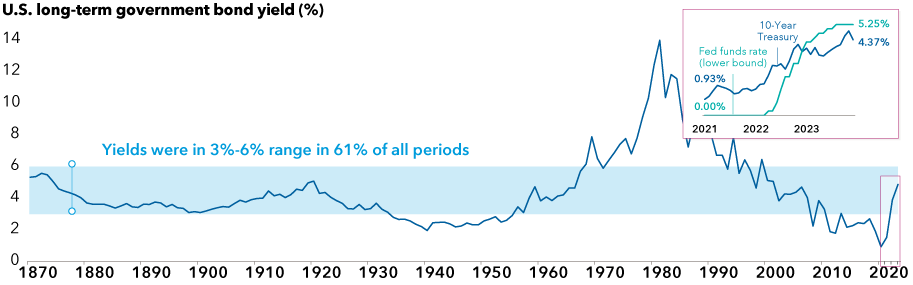
Sources: U.S. Federal Reserve, Robert Shiller. Data for 1871–1961 represents average monthly U.S. long-term government bond yields compiled by Robert Shiller. Data for 1962–2022 represents 10-year Treasury yields, as of December 31 each year within the period. Data for 2023 is as of November 30, 2023. Past results are not predictive of results in future periods.
The end of the hiking cycle means bonds may soon return to the basic roles of providing income and diversification from equity market downturns, says Edmonds. “It’s been a volatile few years for bond investors, but we’ve reached a turning point in the Fed cycle where rate cuts may be coming in 2024, which would be a tailwind for bond returns. Even without cuts, income potential is still a possibility.”
Bloomberg U.S. Aggregate Bond Index represents the U.S. investment-grade fixed-rate bond market.
Bloomberg U.S. Corporate High Yield Index covers the universe of fixed-rate, non-investment-grade debt.
Bloomberg U.S. Corporate High Yield 2% Issuer Capped Index covers the universe of fixed-rate, non-investment-grade debt. The index limits the maximum exposure of any one issuer to 2%.
Bloomberg U.S. Corporate Investment Grade Index represents the universe of investment grade, publicly issued U.S. corporate and specified foreign debentures and secured notes that meet the specified maturity, liquidity and quality requirements.
Bloomberg U.S. Mortgage Backed Securities Index is a market value-weighted index that covers the mortgage-backed pass-through securities of Ginnie Mae (GNMA), Fannie Mae (FNMA) and Freddie Mac (FHLMC).
Bloomberg Municipal Bond Index is a market value-weighted index designed to represent the long-term investment-grade tax-exempt bond market.
The J.P. Morgan Emerging Markets Bond Index (EMBI) Global Diversified is a uniquely weighted emerging market debt benchmark that tracks total returns for U.S. dollar-denominated bonds issued by emerging market sovereign and quasi-sovereign entities.
This report, and any product, index or fund referred to herein, is not sponsored, endorsed or promoted in any way by J.P. Morgan or any of its affiliates who provide no warranties whatsoever, express or implied, and shall have no liability to any prospective investor, in connection with this report.
Our Latest Insights
-
-
Global Equities
-
Artificial Intelligence
-
Technology & Innovation
-
RELATED INSIGHTS
-
-
Global Equities
-
Artificial Intelligence
Commissions, trailing commissions, management fees and expenses all may be associated with mutual fund investments. Please read the prospectus before investing. Mutual funds are not guaranteed, their values change frequently and past performance may not be repeated.
Unless otherwise indicated, the investment professionals featured do not manage Capital Group‘s Canadian mutual funds.
References to particular companies or securities, if any, are included for informational or illustrative purposes only and should not be considered as an endorsement by Capital Group. Views expressed regarding a particular company, security, industry or market sector should not be considered an indication of trading intent of any investment funds or current holdings of any investment funds. These views should not be considered as investment advice nor should they be considered a recommendation to buy or sell.
Statements attributed to an individual represent the opinions of that individual as of the date published and do not necessarily reflect the opinions of Capital Group or its affiliates. This information is intended to highlight issues and not be comprehensive or to provide advice. For informational purposes only; not intended to provide tax, legal or financial advice. We assume no liability for any inaccurate, delayed or incomplete information, nor for any actions taken in reliance thereon. The information contained herein has been supplied without verification by us and may be subject to change. Capital Group funds are available in Canada through registered dealers. For more information, please consult your financial and tax advisors for your individual situation.
Forward-looking statements are not guarantees of future performance, and actual events and results could differ materially from those expressed or implied in any forward-looking statements made herein. We encourage you to consider these and other factors carefully before making any investment decisions and we urge you to avoid placing undue reliance on forward-looking statements.
The S&P 500 Composite Index (“Index”) is a product of S&P Dow Jones Indices LLC and/or its affiliates and has been licensed for use by Capital Group. Copyright © 2024 S&P Dow Jones Indices LLC, a division of S&P Global, and/or its affiliates. All rights reserved. Redistribution or reproduction in whole or in part are prohibited without written permission of S&P Dow Jones Indices LLC.
FTSE source: London Stock Exchange Group plc and its group undertakings (collectively, the "LSE Group"). © LSE Group 2024. FTSE Russell is a trading name of certain of the LSE Group companies. "FTSE®" is a trade mark of the relevant LSE Group companies and is used by any other LSE Group company under licence. All rights in the FTSE Russell indices or data vest in the relevant LSE Group company which owns the index or the data. Neither LSE Group nor its licensors accept any liability for any errors or omissions in the indices or data and no party may rely on any indices or data contained in this communication. No further distribution of data from the LSE Group is permitted without the relevant LSE Group company's express written consent. The LSE Group does not promote, sponsor or endorse the content of this communication. The index is unmanaged and cannot be invested in directly.
BLOOMBERG® is a trademark and service mark of Bloomberg Finance L.P. and its affiliates (collectively “Bloomberg”). Bloomberg or Bloomberg’s licensors own all proprietary rights in the Bloomberg Indices. Neither Bloomberg nor Bloomberg’s licensors approves or endorses this material, or guarantees the accuracy or completeness of any information herein, or makes any warranty, express or implied, as to the results to be obtained therefrom and, to the maximum extent allowed by law, neither shall have any liability or responsibility for injury or damages arising in connection therewith.
MSCI does not approve, review or produce reports published on this site, makes no express or implied warranties or representations and is not liable whatsoever for any data represented. You may not redistribute MSCI data or use it as a basis for other indices or investment products.
Capital believes the software and information from FactSet to be reliable. However, Capital cannot be responsible for inaccuracies, incomplete information or updating of the information furnished by FactSet. The information provided in this report is meant to give you an approximate account of the fund/manager's characteristics for the specified date. This information is not indicative of future Capital investment decisions and is not used as part of our investment decision-making process.
Indices are unmanaged and cannot be invested in directly. Returns represent past performance, are not a guarantee of future performance, and are not indicative of any specific investment.
All Capital Group trademarks are owned by The Capital Group Companies, Inc. or an affiliated company in Canada, the U.S. and other countries. All other company names mentioned are the property of their respective companies.
Capital Group funds are offered in Canada by Capital International Asset Management (Canada), Inc., part of Capital Group, a global investment management firm originating in Los Angeles, California in 1931. Capital Group manages equity assets through three investment groups. These groups make investment and proxy voting decisions independently. Fixed income investment professionals provide fixed income research and investment management across the Capital organization; however, for securities with equity characteristics, they act solely on behalf of one of the three equity investment groups.
The Capital Group funds offered on this website are available only to Canadian residents.