Long-Term Investing
Categories
Practice Management
How to rebalance portfolios
 Michelle Black
November 25, 2018
KEY TAKEAWAYS
- Taxes and transaction costs do not erase the value of rebalancing portfolios.
- There’s no single “right way” to rebalance.
- Choosing the appropriate rebalancing strategy will depend on the target allocation and primary objectives for the exercise.
It’s widely agreed that periodically rebalancing portfolios has a number of benefits for clients. Extensive academic research supports the idea that selling and buying asset classes to keep their proportion in a portfolio aligned with a target is beneficial to align risk and returns with clients’ goals.
Academic research, though, leaves a hole for advisors looking for specific directions to best implement rebalancing for clients. Is there a single “right” way or “wrong” way to rebalance? Do taxes and transaction costs erode away the value of putting portfolios back in balance with the target allocation?
Our research — one of the first to systematically factor in taxes, costs and different asset allocations beyond a traditional balanced portfolio — shows rebalancing can be extremely valuable even with these drags. We found that no single rebalancing strategy wins across all asset allocations. This presents an opportunity for advisors to choose and implement the method of rebalancing that best matches a target asset allocation.
Rebalancing can work — even with taxes and transaction costs
There’s little debate over the value of the idea of rebalancing. Periodically adjusting portfolios to bring different asset classes back to their intended proportions is beneficial over time. It works by creating a discipline of selling assets that are high and buying other asset classes when they’re low. Although it often doesn’t feel good, numerous studies support that rebalancing would have generated better risk-adjusted results than simply buying and holding.
Rebalancing has helped advisors as a form of risk control, by staying true to the intended “risk” profile of a portfolio (measured by annualized standard deviation). However, if that were the only goal, then in theory more frequent rebalancing would always be preferable. In reality, there are other factors to consider, such as taxes, transaction costs and market momentum — the stock market is up more than it is down (over 80% of rolling 12-month periods from 1946 to 2016).
Therefore, we added an additional metric to our study: tracking error. In this context, tracking error is the standard deviation of the difference in returns between the different rebalancing methods and the rebalanced monthly strategy used as a control. Ideally, a rebalancing strategy would minimize tracking error and the number of rebalances, while maximizing Sharpe ratio.
Our results further support the value of rebalancing regardless of whether portfolios are light on equity (25% of the portfolio) or heavy on equity (85% of the portfolio).
This holds true, we found, even after adding in the drags of federal capital gains taxes and transaction costs. In our analysis, we applied a 20% long-term capital gains tax rate (we did not consider state taxes) and trading costs of 0.2%, which was our simplifying assumption. Our study looked at returns over the 157 10-year rolling periods from October 1994 to September 2017. Returns were measured by the average annualized 10-year returns in each rolling period, minus taxes and transaction costs. Risk or standard deviation was calculated by looking at the average volatility of monthly portfolio values in each rolling 10-year period, after taxes and trading costs.
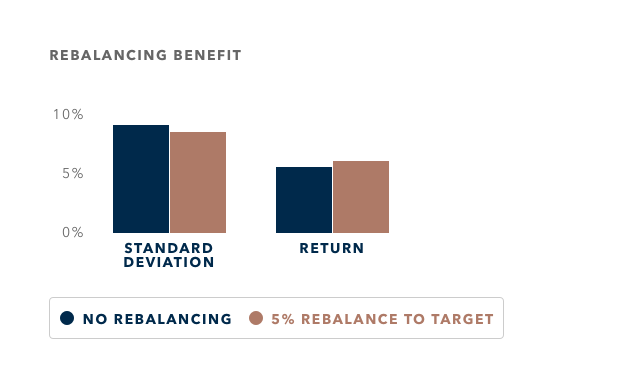
Consider a typical portfolio that’s moderately allocated to equity (55% equity comprised of 36% MSCI World Index, 10% Standard & Poor’s 500, 4% MSCI ACWI Small Cap and 5% MSCI Emerging Markets) with the rest held in fixed income investments (specifically the Bloomberg Barclays Municipal 1–10 Year 1–12 Year Blend Index and municipal bonds). By using a common rebalancing approach — where the portfolio is brought back into alignment after an asset class deviates by 5% from the target — annualized standard deviation declined to 8.9% compared with the 9.02% standard deviation of a portfolio that’s not rebalanced at all.1 Returns rose slightly, too, rising from 5.74% for the unrebalanced portfolio to 5.97% after rebalancing. The client would have benefited with a portfolio that was more stable without losing any return.
Rebalancing benefit
A 5% rebalance of a moderate equity portfolio (55% equity) would have reduced risk and maintained risk-adjusted returns:
Source: Capital Group
The many ways to rebalance
Rebalancing has worked. But how is it implemented? Should advisors rebalance based on wider ranges to “let the portfolio ride market momentum” and minimize taxes and costs, or use tighter bands to keep the volatility in check?
To help determine how advisors might rebalance, we examine eight possible strategies, including:
Approach 1: No rebalancing
Approach 2: 10% absolute deviation from target, returned to target. Here, the allocation is rebalanced back to the target after equity strays 10 percentage points or more from the target. That means you would rebalance an equity position in a 60/40 portfolio if equity fell to less than 50% of the portfolio, or rose to 70% or greater. The equity percentage would be restored to 60%.
Approach 3: 10% absolute deviation from target, returned to half of target. Again, you would rebalance an equity position in a 60/40 portfolio on a 10-percentage-point move: A rebalance would trigger if equity fell to less than 50% of the portfolio, or rose to 70% or greater. But here, the allocation is rebalanced halfway back to the target. If the equity position fell to 50%, it would be restored to 55%. If it rose to 70%, it would be trimmed to 65%.
Approach 4: 10% relative deviation from target, returned to target. Here, the allocation is rebalanced to the target after straying by an amount equal to 10% or more of the targeted allocation. That means you would rebalance an equity position in a 60/40 portfolio if equity fell to less than 54% of the portfolio, or rose to 66% or greater. That is because the six-percentage-point move in either way is 10% of the 60% equity allocation. The equity proportion would be returned to 60%.
Approach 5: 10% relative deviation from target, returned to one-half of target. Again, the allocation is rebalanced after straying by an amount that is 10% or more of the targeted allocation. But rather than restore to the target, you restore halfway between the current allocation and the target. In the case of an equity allocation decline to 54%, the equity position would be returned to 57% (halfway between the current allocation of 54% and the target of 60%).
Approach 6: 5% absolute deviation from target, returned to target. Here, the allocation is rebalanced back to the target after equities stray five percentage points or more from the target. That means you would rebalance an equity position in a 60/40 portfolio if equity fell to less than 55% of the portfolio, or rose to 65% or greater. The equity portfolio of the allocation would be returned to 60%.
Approach 7: 5% absolute deviation from target, returned to one-half of target. Again, the allocation is rebalanced after equities stray five percentage points or more from the target. That means you would rebalance an equity position in a 60/40 portfolio if equity fell to less than 55% of the portfolio, or rose to 65% or greater. But this time, if the equity position fell to 55% it would be restored to 57.5%. If it rose to 65%, it would be trimmed to 62.5%.
Approach 8: Monthly rebalance. Automatically rebalanced to match target allocations at the end of each month.
All portfolios were reviewed using monthly observations.
Which rebalancing method is best?
Some advisors might hope one specific rebalancing method was clearly superior to the others, but our study didn’t bear that out. In most aspects, differences were small between rebalancing approaches. Portfolios’ average returns, volatility and Sharpe ratios were close using all approaches as long as they were rebalanced.
The type of rebalancing strategy used had the largest effect in the areas of tracking error and the number of rebalances triggered.
When looking to decide which method to adopt, advisors should focus on the one that would have controlled trading costs, and achieved a low tracking error combined with a high Sharpe ratio and a low number of rebalances (for simplicity and ease of management).
It turns out that the optimal choice varied based on the portfolio’s asset allocation. We looked at how each type of rebalancing affected five portfolios based on several common asset allocations, including:2
- Low equity: 25% in stocks and the rest in fixed income.
- Moderately low equity: 40% in stocks and 60% in fixed income.
- Moderate equity: 55% in stocks and 45% in fixed income.
- Moderately high equity: 70% in stocks and 30% in fixed income.
- High equity: 85% in stocks and 15% in fixed income.
Looking at how these five asset allocations reacted to the eight approaches to rebalancing, we found:
- Any rebalancing method is usually better than nothing.
Choosing the optimal way to rebalance is somewhat of an academic exercise, as the biggest benefit results in simply rebalancing. Not rebalancing may be simple — triggering no rebalance events over the 10-year rolling periods, of course — but also frequently delivered suboptimal results across all five asset allocations. Not rebalancing resulted in among the highest standard deviation for all of the asset allocations we studied, except for the high-equity allocation, and never resulted in the lowest standard deviation for any of the portfolios.
By not rebalancing, clients may be exposed to more volatility than they otherwise may have expected. It may be thrilling to ride the wave of a rising equity market, but clients may also suffer larger declines when the market turns.
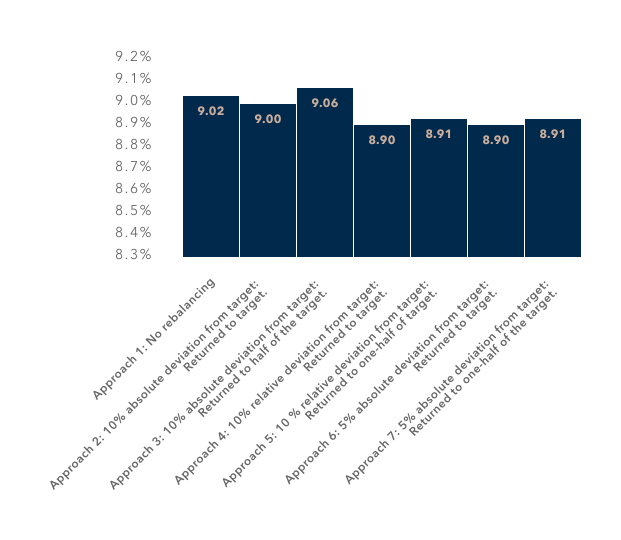
The chart below illustrates this with the moderate-equity portfolio.
Any rebalance better than none
With a moderate-equity portfolio, standard deviation was lower with most approaches vs. no rebalancing:
Source: Capital Group
The 5% absolute: Halfway to target rebalancing strategy may be a good default.
- Advisors unclear on which rebalancing method to use might opt for the 5% absolute halfway to target. We found this method to generate among the best Sharpe ratios in three of the five asset allocations we examined, as it strikes a nice balance between minimizing the cost of rebalancing while continuing to benefit from market momentum. The low-equity and moderately low equity models were the only exceptions, and even here this rebalancing method was tied for second-best.
Our analysis shows the 5% absolute method would have worked almost across the board, with the only exception being moderately low equity portfolios.
- Rebalancing may be most valuable with moderately low and moderate-equity portfolios.
Advisors with clients in moderately low and moderate portfolios might pay even more attention to rebalancing. Both allocations benefited from a 10-basis-point or greater reduction in average volatility in the best-case scenario over no rebalancing. This can be attributed to the diversification benefits of having sizable weights in lowly correlated asset classes.
- Focus on which method is best for minimizing tracking error or controlling the number of rebalancing actions.
Advisors, as long as they rebalance, achieve most of the benefits no matter which approach they take. But the approach matters more when the goals are to either reduce tracking error — how much a portfolio strays from one that is rebalanced monthly — or limit the number of rebalances.
In either case, it is worthwhile to vary the method to use based on the portfolio’s asset allocation and your goal for the portfolio. Here’s what we found:
Guidance #1: When staying true to the intended allocation profile is the goal
Both of the 5% absolute rebalancing strategies resulted in the lowest tracking error for moderately high equity and high-equity asset allocations. For moderate-equity portfolios, the 5% absolute rebalancing strategy was second-best for minimizing tracking error, just behind 5% absolute returned halfway to target.
But with low to moderately low equity models, the 10% relative rebalancing techniques tended to most effectively minimize tracking error. This makes sense, as a 10% relative move creates tighter bands for portfolios with a lower-equity target.
Guidance #2: When simplicity is the goal
An advisor might choose the strategy that reduces portfolio churn, since the differences in Sharpe ratios are so small. A 10% absolute rebalancing technique generated the lowest number of rebalance events on average, consistent across asset allocations. With the moderate-equity allocation, for example, the 10% absolute returned to target strategy resulted in just 2.4 rebalances on average over the 10-year rolling periods. This translates to a rebalance occurring about every five years! However, keep in mind that in the high-equity allocation, this strategy would rarely trigger a rebalance and, thus, the portfolio would not have benefited from rebalancing. Therefore, this may only be appropriate for moderately high equity allocations and below. For high-equity allocations, the average number of rebalances is low across the board, so one may choose a strategy based on other goals and to preserve the benefits of having equity diversification in the first place.
Conclusion: What should you do?
If there’s a bottom-line conclusion, it’s that there’s no one-size-fits-all rule when it comes to which approach to rebalancing will yield the best result. It’s up to the advisor to balance the need to remain close to the portfolio target allocation and control the number of rebalances.
If there is a rule of thumb, it’s this: Consider adopting relative triggers for porfolios with lower equity positions (less than 50%), and 5% absolute triggers for porfolios with higher equity (greater than 50%).
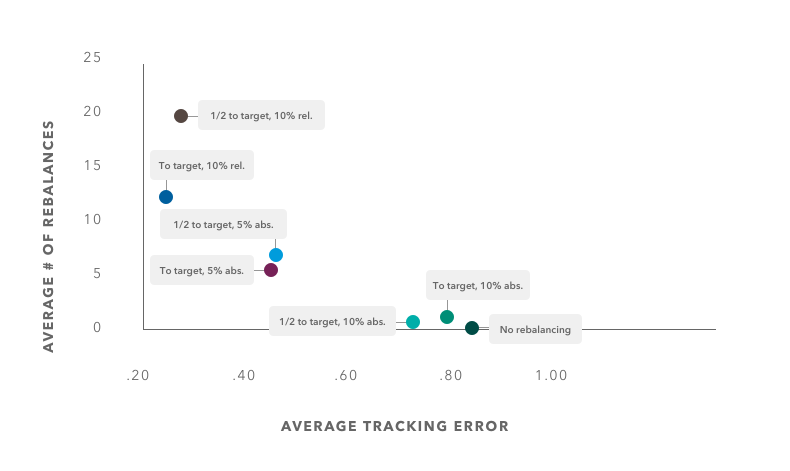
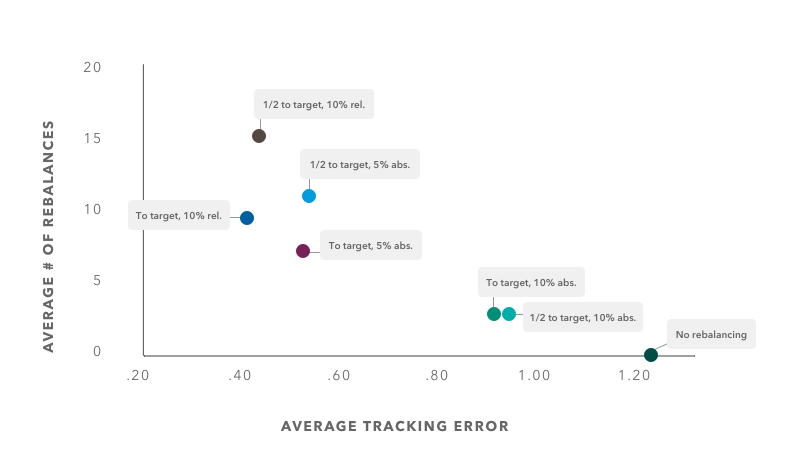
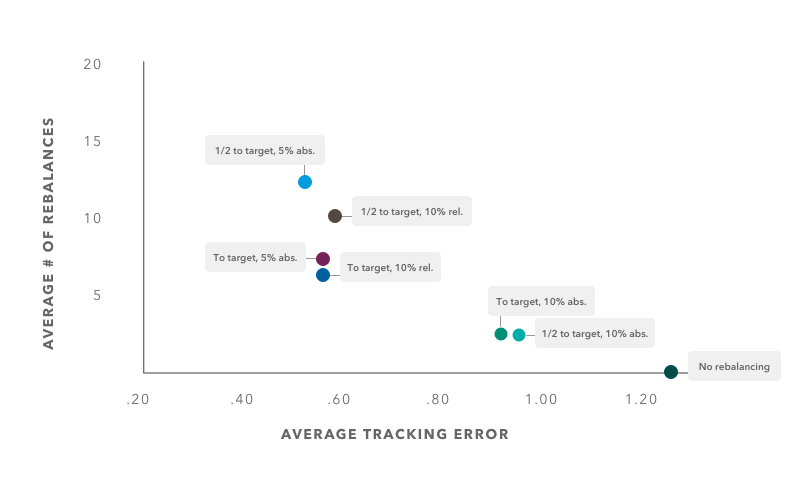
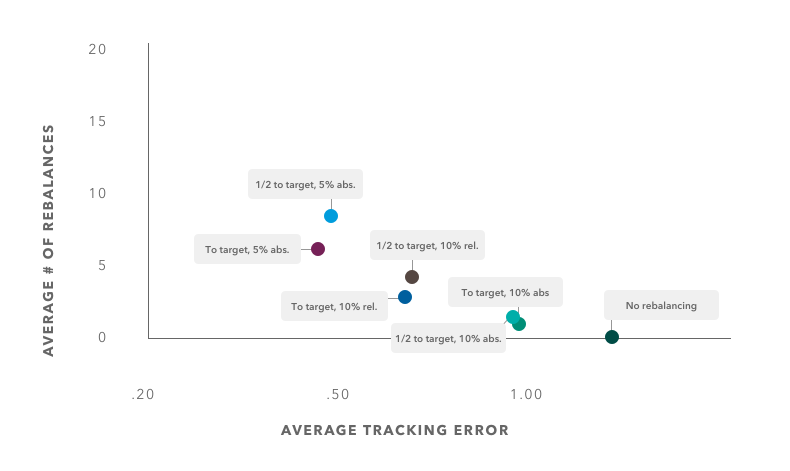
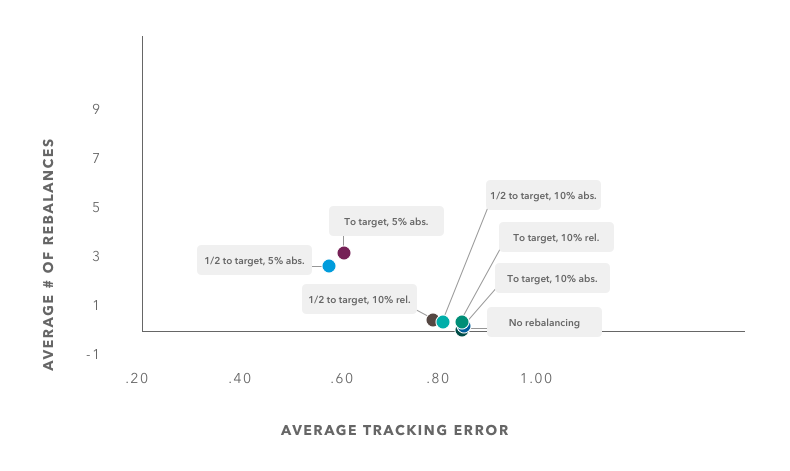
Below are charts to help you. Start by finding the chart representing the type of portfolio you are evaluating, such as low equity. Then look at the lower left-hand quadrant of the grid for the approach that best minimizes the number of rebalances and tracking error.
These charts plot the number of rebalances and average tracking error for each type of portfolio:
The rebalancing approaches we examined
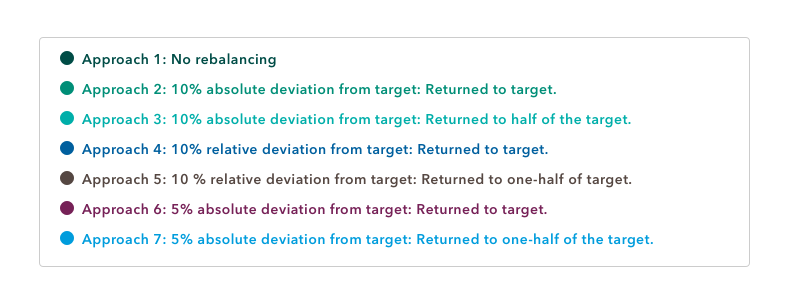
Source: Capital Group
Low equity
Source: Capital Group
Moderately low equity
Source: Capital Group
Moderate equity
Source: Capital Group
Moderately high equity
Source: Capital Group
High equity
Source: Capital Group
Contributing:
Javier Escamilla, Wealth Specialist
Zori Santiago, Wealth Specialist
Jeff Ruderman, Wealth Specialist
1For our analysis, we used monthly return streams for the underlying components of the portfolios. The rebalance is triggered automatically anytime the portfolio deviated by 5% from the target allocation, which could only occur at month ends because we used monthly returns.
2Each asset allocation is based on a collection of market indexes. The Low Equity portfolio is 20% MSCI World (MSCIW), 5% Standard & Poor’s 500 (S&P 500), 70% Bloomberg Barclays Municipal 1–10 Year 1–12 Year Blend Index (BBB 1–12) and 5% is a 50/50 blend of Bloomberg Barclays Muni High Yield and Bloomberg Barclays Muni (BBBHYM). Moderately Low Equity is 25% MSCIW, 10% S&P 500, 5% MSCI Emerging Markets (MSCI EM), 55% BBB 1–12 and 5% BBBHYM. Moderate Equity was 36% MSCIW, 10% S&P 500, 4% MSCI All Country World Index Small Cap (ACWISC), 5% MSCIEM, 40% BBB 1–12 and 5% BBBHYM. Moderately High Equity was 46% MSCIW, 13% S&P 500, 5% ACWISC, 6% MSCI EM, 25% BBB 1–12 and 5% BBBHYM. High Equity was 50% MSCIW, 12% MSCI All Country World Index, 10% S&P 500, 7% ACWISC, 6% MSCI EM and 15% BBB 1–12.
MSCI World is a global equity index designed to track the results of large- and mid-capitalization stocks in 23 developed markets. It aims to cover 85% of the free float-adjusted market value in each country. The index does not hold emerging-markets equities.
Standard & Poor’s 500 is a widely followed benchmark of large-capitalization U.S. stocks. The index includes 500 large companies and aims to capture 80% of the U.S. market capitalization.
MSCI Emerging Markets is an index that tracks the results of equities in 24 emerging markets that represent 10% of world market capitalization.
MSCI All Country World Index is an index designed to measure the global equity market, including 23 developed and 24 emerging markets.
MSCI All Country World Index Small Cap is a subset of the MSCI All Country World Index that includes equities of small capitalization companies.
Bloomberg Barclays Muni (BBBHYM) is a market-value weighted index that tracks the long-term tax-exempt market. Bonds included in the index must be investment-grade rated or higher by at least two major ratings agencies. Bond must have an outstanding par value of at least $7 million and be part of an issuance of at least $75 million. Included bonds must be fixed rate, dated after December 31, 1990, and at least a year from the maturity date. Remarketed, taxable, floating rate and derivatives are excluded.
Bloomberg Barclays Municipal 1–10 year Blend 1–12 year index (BBB 1–12) is a subset of the Bloomberg Barclays Municipal Bond index. It holds four types of bonds: general obligation, revenue, insured and prerefunded.
Bloomberg Barclays Muni High Yield is a fixed income index designed to track the high-yield municipal bond market. It has a 25% weighting in investment-grade triple-B bonds and 75% weighting in non-investment grade bonds.
Investment results assume all distributions are reinvested. Market indexes are unmanaged and, therefore, have no expenses. Investors cannot invest directly in an index.
Learn more about
RELATED INSIGHTS
-
-
Retirement Income
-
Client Conversations
Investments are not FDIC-insured, nor are they deposits of or guaranteed by a bank or any other entity, so they may lose value.
Investors should carefully consider investment objectives, risks, charges and expenses.
This and other important information is contained in the mutual fund prospectuses and summary prospectuses, which can be obtained from a financial professional and should be read carefully before investing.
Statements attributed to an individual represent the opinions of that individual as of the date published and do not necessarily reflect the opinions of Capital Group or its affiliates. This information is intended to highlight issues and should not be considered advice, an endorsement or a recommendation.
All Capital Group trademarks mentioned are owned by The Capital Group Companies, Inc., an affiliated company or fund. All other company and product names mentioned are the property of their respective companies.
Use of this website is intended for U.S. residents only.
Capital Client Group, Inc.
This content, developed by Capital Group, home of American Funds, should not be used as a primary basis for investment decisions and is not intended to serve as impartial investment or fiduciary advice.
Use of this website is intended for U.S. residents only.