
Global Affairs
Market Volatility
Uncertainty remains high as investors navigate shifting tariff policy
The stock market somersaults of the past weeks hold any number of lessons for investors. But here are two of the biggest: The head-snapping moves show just how furiously the market can thrash about in just a few days — in fact, sometimes in just a few minutes. And the wisest strategy is to avoid overreacting and stick to your investment plan regardless of the way momentary winds are blowing.
Even by the standards of market volatility, the moves of late have been eye-popping. First, the market was gobsmacked by a tariff rollout that despite being universally telegraphed was still a shock. Investors had braced for “reciprocal” tariffs. But they were blindsided by their magnitude and scope, partly because President Trump’s vacillation on earlier tariff proclamations had stirred hope that the levies would lean to the softer side.
Stocks corkscrewed lower as the tariff package — 10% across-the-board levies on most U.S. trading partners plus huge country-specific duties — spawned a garble of short-term fears and long-term questions.
On the immediate front, the most timely concerns centered on the risk of higher inflation and rising threat of recession. A protracted trade dispute could provoke back-and-forth retaliatory volleys that dent corporate earnings and further erode consumer and business confidence. None of these issues was a major worry at the start of the year. Investors expected the Trump administration to prioritize market-friendly tax cuts and deregulation — and to measure itself by the performance of equity prices as in the president’s first term.

Make sense of the tariffs and trade policies.
A second surprise came a few days later, as Trump paused the reciprocal tariffs for most countries for 90 days — with the exception of China, on which he boosted levies to 145%. Stocks blasted higher moments later, with major indices reclaiming a chunk of their losses of earlier days.
Market uncertainty remains high.
The situation remains fluid with many questions still unanswered. That starts with the inflationary impact of towering duties on Chinese goods. Other tariffs also remain in place. Those include the 10% blanket duty; 25% levies on steel and aluminum; and 25% surcharges on foreign-made cars and parts. Indeed, the stock market weakened again on Thursday as investors sifted through the latest developments.
Uncertainty was at its second-highest point in 40 years
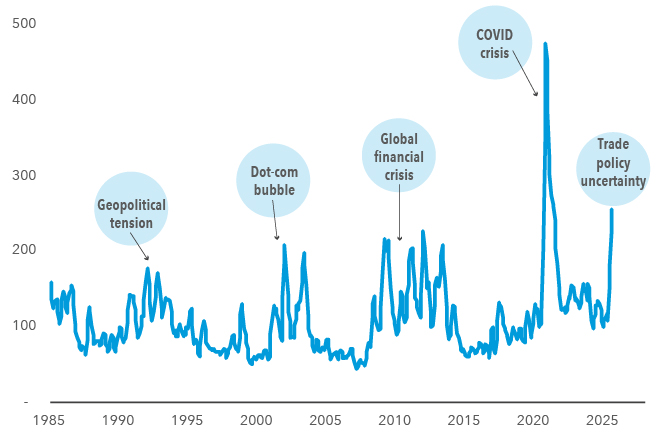
Sources: Federal Reserve Bank of St. Louis, Economic Policy Uncertainty Index. Uncertainty is represented by the Economic Policy Uncertainty Index, which measures policy-related uncertainty by tracking newspaper coverage of economic policy-related uncertainty, including terms like "uncertain," "uncertainty," "economy," and "policy.“ Monthly data from January 1, 1985, to March 1, 2025.
There are long-run questions, too. Investors are gaming out the possibility of a permanent realignment in a system of global commerce that has been in place since the end of World War II. It’s hard to gauge the economic impact of what boils down to political decisions rather than strict financial happenings. Despite the 90-day pause, it’s unclear whether the developments to this point will cause long-lasting changes in corporate and investor behavior around the world. Beyond the tariffs themselves, many investors are also uneasy over the upheaval in Washington, including mass government layoffs, aggressive deportations and strained diplomatic relations with longtime foreign allies.
Despite the economic worries and some mixed indicators of late, the U.S. economy comes into this period with some underlying core strengths that may help it weather the storm. Those include low unemployment, positive wage growth, strong productivity and solid corporate balance sheets.
Avoid abrupt portfolio decisions in a trying market.
By their very nature, sharp market declines and cloudy economic outlooks can be deeply unsettling for investors. Nevertheless, it’s important to proceed with caution — and to maintain a balanced and diversified portfolio — because abrupt moves can damage long-term investment results. Client portfolios have been structured with great care in the expectation of periodic turbulence. Our portfolio managers are always cognizant of capital preservation and downside risk.
It’s also critical to place these moments in historical context. As unpleasant as it is, volatility is a normal part of investing and intra-year corrections of 10% or more are normal. What’s more, a survey of such market declines in the last 25 years shows that they often have not been precursors to full-blown recessions.
U.S. market declines have not reliably predicted recessions
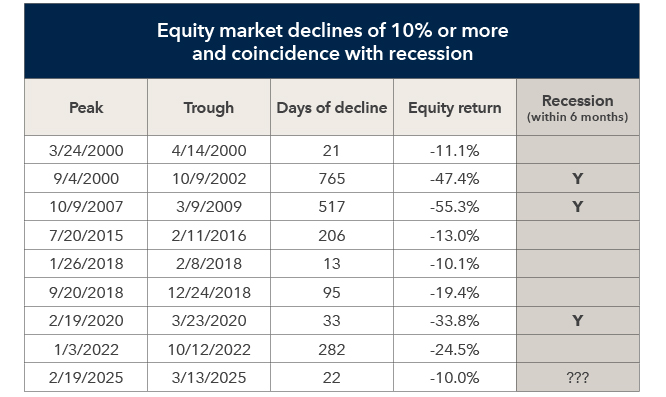
Sources: LSEG, National Bureau of Economic Research (NBER). Equity returns are represented by the S&P 500 Total Return index. Equity market corrections are defined as periods during which the market loses 10% or more from a prior peak. New periods begin once the market has recovered to the prior peak. Recessions are determined by NBER and involves a significant decline in economic activity that is spread across the economy and lasts more than a few months. The indexes are unmanaged and, therefore, have no expenses. Investors cannot invest directly in an index. Past results are not predictive of results in future periods. As of March 31, 2025.
Given the importance of downside protection, Capital Group portfolio managers have sought to limit exposure to cyclically oriented industries that are thought to be most vulnerable to a tariff induced slowdown. Certain portfolios are less exposed to the energy, automobile, housing and banking industries than their benchmark indexes. These portfolios are also significantly less exposed to the so-called Magnificent Seven technology giants than their respective indexes.
Though most sectors of the U.S. and global equity markets slumped after the tariff announcement, international markets as represented by MSCI All Country World Index excluding U.S. have dramatically outpaced the U.S., as represented by the S&P 500 Index, since the start of the year amid a powerful rotation into value-oriented stocks, including solid dividend payers. As well, a weakening U.S. dollar can help cushion certain international stock returns for U.S. investors.
Fixed income has been a relative bright spot this year, helping to cushion portfolios amid the equity fluctuations. If the U.S. economy weakens, the Federal Reserve may be moved to cut interest rates, which would be positive for bondholders.
In conclusion, we believe a diversified portfolio and carefully curated mix of investments, including a cross-section of global stocks and bonds, can help reduce the chance of an adverse market event deeply impacting your wealth. Though the urge to lighten exposure to stocks or bonds can seem appealing during trying moments, we believe the best course is to look through short-term turbulence.
Explore topics
The Magnificent Seven technology stocks are Google parent Alphabet, Amazon.com, Apple, Facebook owner Meta Platforms, Microsoft, Nvidia and Tesla.
S&P 500 Index is a market capitalization-weighted index based on the results of approximately 500 widely held common stocks. This index is unmanaged, and its results include reinvested dividends and/or distributions but do not reflect the effect of sales charges, commissions, account fees, expenses or U.S. federal income taxes.
S&P 500 Index is a market capitalization-weighted index based on the results of approximately 500 widely held common stocks. This index is unmanaged, and its results include reinvested dividends and/or distributions but do not reflect the effect of sales charges, commissions, account fees, expenses or U.S. federal income taxes.
MSCI All Country World Index ex USA is a free-float-adjusted market-capitalization-weighted index that is designed to measure equity market results in the global developed and emerging markets, excluding the United States. The index consists of more than 40 developed- and emerging-market country indexes. When applicable, results through December 31, 2000, reflect dividends gross of withholding taxes, and dividends net of withholding taxes thereafter. This index is unmanaged, and its results include reinvested dividends and/or distributions but do not reflect the effect of sales charges, commissions, account fees, expenses or U.S. federal income taxes.