Bonds
Municipal bonds faced steep losses last year, as persistently high inflation and a hawkish Federal Reserve sent fixed income markets tumbling to multi-decade lows. But the worst appears to be over, and the unprecedented downturn has potentially unearthed fresh opportunities that could lead to a more favorable year for munis.
Investors are now eyeing more attractive income levels, with the yield to worst on the Bloomberg Municipal Bond Index climbing from 1.7% in early 2022 to 3.6% in February. Valuations have cheapened, particularly on the longer end of the yield curve, creating a relatively attractive entry point. Technicals have been supported by a slowdown in issuance and, as inflation cools and the Fed slows its pace of rate increases, they may be further aided by potential strong mutual fund inflows to the sector.
Meanwhile, many states remain on strong financial footing. Pandemic-era federal stimulus and strong tax receipts have contributed to solid revenue growth and record rainy-day funds, in turn bolstering many state balance sheets.
Our team of muni portfolio managers and investment analysts share five themes shaping their outlooks for 2023.
1. Expect resilience amid recessionary fears
Chad Rach, portfolio manager, The Tax-Exempt Bond Fund of America®
If we enter a recession that is modest in both its length and severity, certain municipal bonds should be well positioned to ride out the downturn.
To be sure, I don’t see a recession as a foregone conclusion. I’m watching for indicators like a spike in unemployment as a sign that a downturn may be around the corner, and I remain concerned about stubbornly high inflation and the potential for more rate hikes.
Still, large parts of the municipal bond market should be relatively sturdy, even amid economic weakness. Many investment-grade (BBB/Baa and above) tax-exempt entities have durable revenue streams that should be resilient, even amid a downturn. For example, demand for water and sewer, airports and toll roads will likely continue given the essential nature of those services. Even when financially stressed, most consumers will pay those expenses while cutting back on discretionary spending. It usually takes a financial shock, perhaps comparable to the great financial crisis, for many investment-grade municipal entities to see a material weakening in fundamentals.
In the high-yield segment of the muni market, we may see one-off credit issues emerge, but I do not expect systemic weakness in that part of the market either. Any deterioration in high-yield credits will likely be modest, with rare defaults.
I expect a recession would prompt the Fed to become more dovish. A rate rally may remove a headwind for munis leading to potential inflows into muni bonds, as some investors have been on the sidelines waiting for interest rates to settle in a range. Moreover, today’s higher yields provide a cushion for volatility in the road ahead.
Munis have shown relative outperformance in periods of financial stress
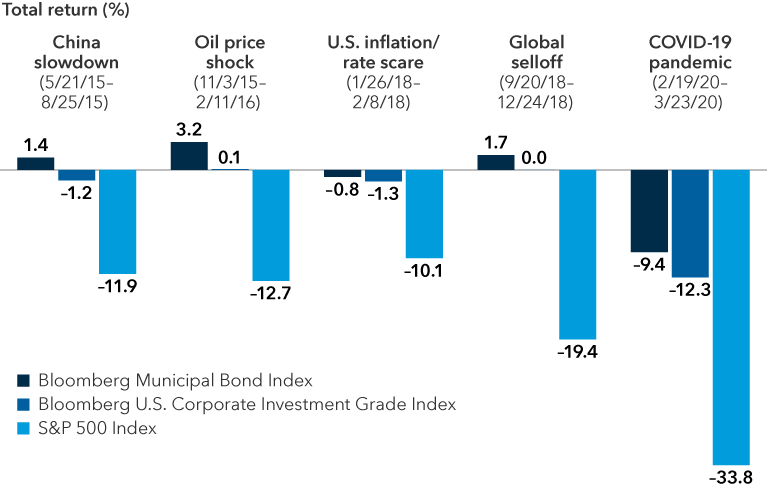
Sources: Capital Group, Morningstar. Dates shown for market corrections are based on price declines of 10% or more (without dividends reinvested) in the S&P 500 with at least 75% recovery persisting for more than one business day between declines. Includes all completed corrections between January 1, 2015, and December 31, 2022. As of December 31, 2022, a correction period is ongoing, and data is not yet available. Returns are based on total returns in USD. Past results are not predictive of results in future periods.
2. Seek opportunities in yield curve positioning
Mark Marinella, portfolio manager, Capital Group Intermediate Municipal SMA
Yield curve positioning is set to be one of the most important elements of our team’s muni bond investment strategy this year. (A yield curve represents the difference in yields between bonds of different maturities. Yield curves are said to be inverted when shorter term yields are greater than longer term yields.)
In the portfolios I manage, I prefer municipal bonds at the longer end of the curve over shorter dated securities. Pairing these positions with above-benchmark exposure to short-dated Treasuries and an underweight position in longer term Treasuries could be additive to results.
Historically speaking, municipal bond yields have tended to move directionally with Treasury rates but with dampened volatility. Parts of the municipal bond curve followed Treasuries down and inverted in late 2022, which is highly unusual. But overall, the muni curve is still unusually steeper than the Treasury curve. For example, within the Bloomberg Municipal Bond Index, 10-year bonds were yielding 7 basis points more than 2-year bonds at the end of January, while the curve among comparable Treasuries was inverted, with 2-year bonds yielding 76 basis points more than 10-year bonds.
While we may see a steepening of both the Treasury curve and the muni curve in the coming months, I have conviction that the Treasury curve should steepen more. By pairing the muni and Treasury positions, portfolios should benefit from this positioning as long as the gap between the two shrinks.
Muni curve looks abnormally steep versus Treasuries
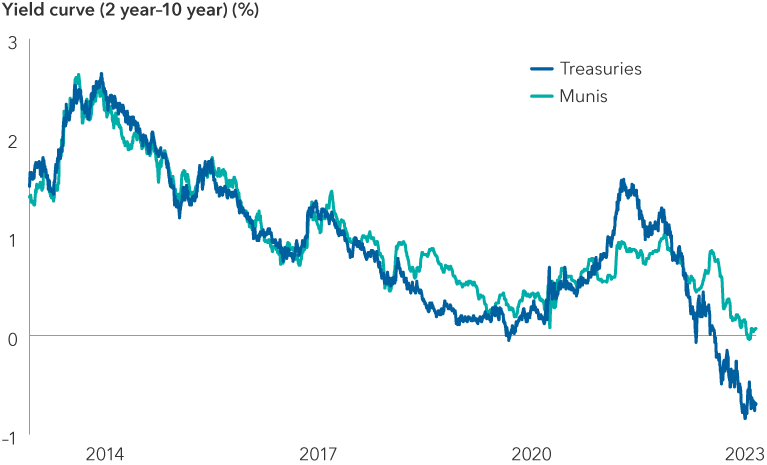
Source: Bloomberg. Data as of January 31, 2023. The 2s10s curve is a measure of the difference in yields between two-year and 10-year bonds.
I have shifted the portfolios I manage from short duration to neutral. (Duration measures how much a bond’s price changes if interest rates fluctuate, so a move from short duration to neutral represents a belief that interest rates will stabilize.) Only if we hit a deep recession do I feel certain that Treasury yields would fall meaningfully. If we plod along with modest but slow growth, or a modest recession, the Fed may not make drastic changes. But I don’t have a strong conviction on the next interest rate move, which is why I am focused on curve positioning.
3. Find value in discounted low-coupon bonds
Courtney Wolf, portfolio manager, The Tax-Exempt Bond Fund of America®
I see numerous pockets of value in muni bonds related to coupon and call structure positioning. Taking an active view of the structure of bonds is a way to pursue strong relative results, particularly in times of heightened rate volatility.
When rates are moving dramatically, municipal bonds’ callability (issuers’ ability to pay them off early) becomes an important concern. I see value in low-coupon bonds, which tend to be trading below par (their face value). In this rate regime, bonds with coupons of 3% or lower appear unlikely to be called away and can provide competitive total returns if rates rally.
Conversely, I am less optimistic about the risk-adjusted return outlook for 4% coupon bonds with longer maturities and short call dates that are trading around par. These bonds have meaningful downside potential if rates rise. However, if rates fall, they have limited upside potential, as there is a high risk of them being redeemed by issuers.
In this current interest rate regime, I am constructive on high-quality, longer maturity bonds with coupons of 5% or higher. They are generally trading at a premium relative to par today. However, I remain cautious that a significant increase in long-term interest rates could push them into a similar situation as we see with 4% bonds, where markets could begin pricing them to their maturity date if the prices fall below par. I believe it’s prudent to avoid municipal bonds trading at or near par in this volatile market.
Callability limits upside for munis trading around par
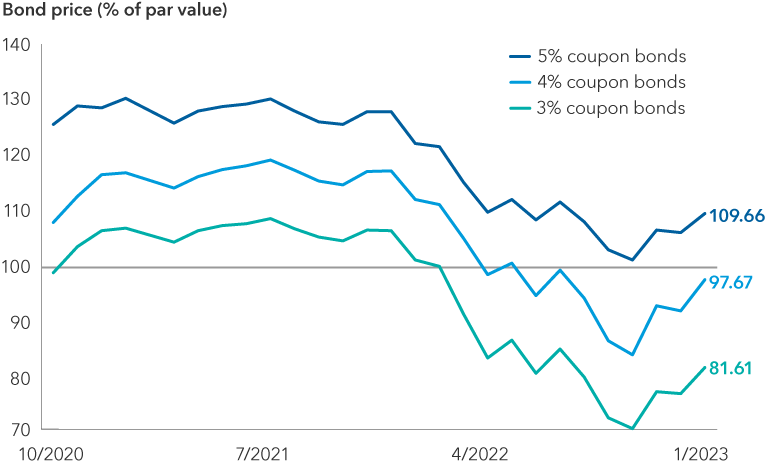
Source: Bloomberg. Chart shows the average price of bonds with maturities greater than 20 years, with call dates between December 31, 2030, and December 31, 2033, in the Bloomberg Municipal Bond Index, separated out by the coupon payment they offer to investors. The average price for bonds with a 4% coupon is very close to par ($97.67 as of January 31, 2023), while average 5% bonds are trading at a premium ($109.66), and 3% bonds are trading at a steep discount ($81.61).
4. Explore opportunities in housing and waste management, tread carefully in health care
Jerry Solomon, portfolio manager, American High-Income Municipal Bond Fund®
Paul Ko, investment analyst
Connie Lu, investment analyst
A softening economy and lasting impacts from the pandemic have led to opportunities in some industries and sectors and headwinds in others.
We see value in housing bonds, which may appear contrarian given the nationwide softening in housing prices. However, we see demand holding up for many parts of this sector, where state housing agencies work with middle-to-lower income first-time borrowers to secure mortgage financing at attractive terms and assist with down payments. We prefer housing bond portfolios that tend to feature low delinquency rates, over-collateralization and guarantees from the government-sponsored enterprises (GSEs) on some of the underlying mortgages.
Within the housing sector, we’re finding value in short-end planned amortization class (PAC) bonds, with spreads on these AAA-rated credits comparable to those on broader BBB-rated munis. (PAC bonds are specialized fixed income securities designed to mitigate prepayment risk by implementing a steady payment schedule.)
We’re also focused on longer term housing bonds that are secured by a first lien position on a mortgage and trading at deep discounts in the secondary market. In California, which has been hammered by skyrocketing housing costs, we’re finding opportunities in apartment projects that are converting market-rate units to income-restricted units (available only to those whose income falls into a specific range).
PAC bonds have provided a relative yield advantage
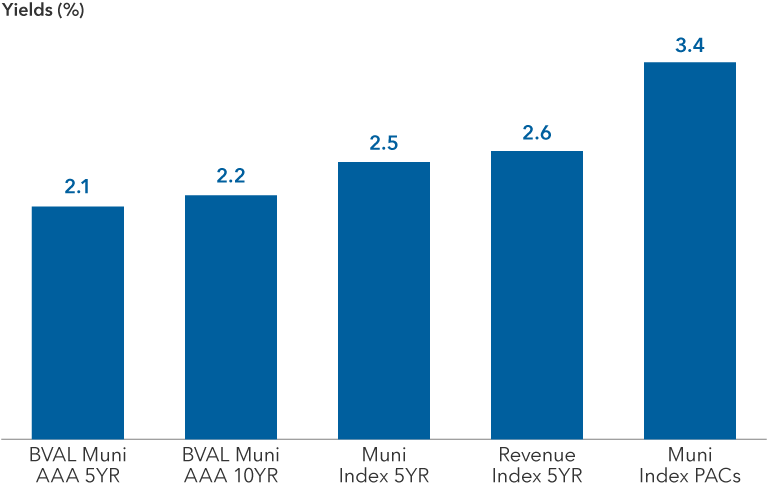
Bloomberg, Capital Group. Data as of January 31, 2023. Yields shown are yield to worst. Indices shown, from left to right, are the BVAL Municipal AAA Yield Curve (Callable) 5 Year; BVAL Municipal AAA Yield Curve (Callable) 10 Year; Muni Index 5 Year, which is a subset of five-year bonds from the Bloomberg Municipal Bond Index; Revenue Index 5 Year, which is a subset of five-year bonds from the Revenue Bond Index within the Bloomberg Municipal Bond Index; and a custom index of PAC bonds pulled from the Bloomberg Municipal Bond Index.
Sectors with strong demand drivers and an ability to pass on higher inflationary costs to customers can be good investments. Waste companies in the business of hauling trash on behalf of municipalities and companies are a prime example. These corporate-backed munis have continued to benefit from strong cash flows and a recession-resilient business model, making them relatively stable during a downturn. We’re finding opportunity across waste operators with considerable size and scale in the investment-grade (BBB/Baa and above) realm and even smaller operators in the high-yield universe.
On the other side of the coin, we are concerned by the deterioration in health care sector fundamentals, which could potentially worsen in the event of another COVID-19 variant wave. Broadly, hospitals are bearing significant margin compression with revenue erosion coupled with surging operating costs, with few signs of a recovery to pre-COVID performance. Patient volumes are challenged by long-standing trends of shrinking, aging populations and care shifting out of the hospital into outpatient settings. Nurses, who were already in short supply before the pandemic, are now leaving acute-care hospitals, demanding higher pay or quitting the industry altogether. Elsewhere, rising wages in non-clinical labor and supply costs are hitting margins. Hospitals have limited inflation pass-through abilities and are forced to bear the brunt of this cost inflation, because they can’t negotiate with Medicare and Medicaid. We are particularly concerned about standalone rural hospitals, as they have especially limited pricing power, fewer cost efficiencies and less ability to attract or pay for talent versus brand-name or better-capitalized peers.
A recessionary environment may be a double-edged sword for health care. Rising unemployment may decrease revenues, but it could also attract workers back to the sector and alleviate the labor shortage. In either case, we see additional downgrades and more distressed credit to come. We have been reducing our exposure to health care bonds broadly, and individual security selection remains critical.
5. Consider the state of the states
Lee Chu, investment analyst
Steve Chuang, investment analyst
Many states entered the year on relatively strong footing, benefiting from high tax collections and pandemic-era federal aid that strengthened balance sheets and led to ratings upgrades. Still, a potential recession could strip away gains, which in turn could lead to budget deficits and pension funding gaps.
Muni general obligation issuers, who can use levers such as taxation to repay outstanding debt, have been lifted by a recent wave of funding. States’ general fund revenues grew 14.5% in fiscal 2022, on top of a record 16.6% increase in the prior fiscal year, to reach $1.17 trillion, according to the National Association of State Budget Officers. Factors ranged from an injection of federal aid to employment growth and positive inflationary impacts. Meanwhile rainy-day funds, which are reserves that states can tap during a downturn, grew by about $55 billion from pre-pandemic levels to reach a record $135 billion in fiscal 2022.
Weaker states, such as New Jersey and Illinois, have especially benefited from revenue growth and the infusion of federal aid via the American Rescue Plan Act and the Coronavirus Aid, Relief, and Economic Security (CARES) Act, which served as a lifeline of sorts. New Jersey, for example, used the funds to meet pension obligations, pay down debt and build its reserves. Illinois repaid debt and financed pandemic-related expenses in areas like mental health services. These actions helped both states secure ratings upgrades in 2022.
State reserve levels could provide some financial cushion
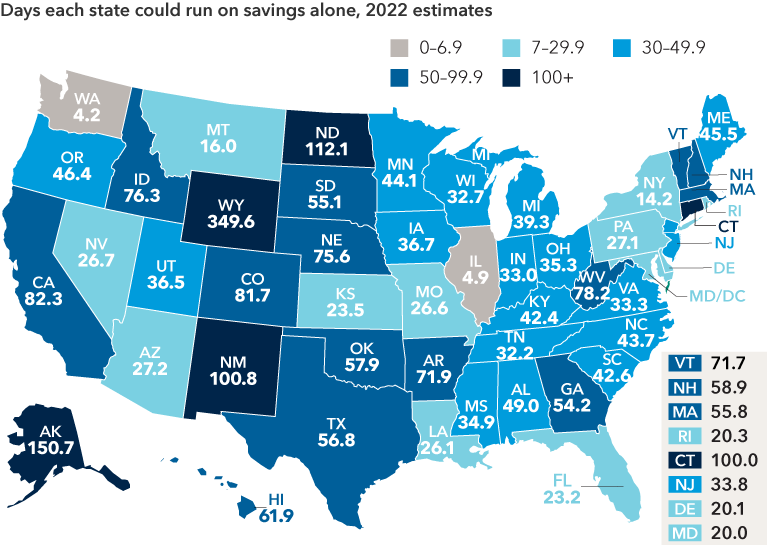
Sources: Capital Group, Pew Charitable Trusts, National Association of State Budget Officers. Data is reported by each state for its fiscal year, which ends June 30 in all but four states: New York (March 31), Texas (August 31), Alabama (September 30) and Michigan (September 30).
Still, some states may struggle this year depending on the depth and severity of a potential recession. Rising unemployment may lead to lower tax revenues, creating revenue-expense gaps, while uneven stock market performance could drag down pension funding ratios. Reserve levels will play a key role in plugging these holes, and we expect states with low reserves to remain under pressure as they attempt to bridge those gaps.
We see this potential weakening in fundamentals as a path to cheapening valuations. We will look to add exposure to select stronger issuers at more attractive levels as and when markets provide us the opportunity.
The bottom line
After a challenging year in 2022, muni investors have reason to be optimistic. The potential end of the Fed rate-hiking cycle could lead to opportunities in curve positioning and select coupon structures. As a potential recession nears, municipal bonds could be a source of resilience in sectors like housing and waste management. Meanwhile, states look set to reap the benefits of their strong financial position and add stability to the sector.
Even though the fog of uncertainty hasn’t fully cleared, the range of opportunities appears to be widening. We see the potential for more favorable market conditions in the year ahead.
The return of principal for bond funds and for funds with significant underlying bond holdings is not guaranteed. Fund shares are subject to the same interest rate, inflation and credit risks associated with the underlying bond holdings.
The value of fixed-income securities may be affected by changing interest rates and changes in credit ratings of the securities.
Lower rated bonds are subject to greater fluctuations in value and risk of loss of income and principal than higher rated bonds.
Duration is a measure of the approximate sensitivity of a bond portfolio's value to interest rate changes.
A credit spread is the difference in yield (the expected return on an investment over a particular period of time) between a government bond and another debt security of the same maturity but different credit quality. Credit spreads typically measure the perceived riskiness of a corporate bond relative to a safer investment, typically the equivalent government bond; the wider the spread, the riskier the corporate bond. A period of widening (increase in the spread) reflects an increase in this perceived credit riskiness. The value of fixed income securities may be affected by changing interest rates and changes in credit ratings of the securities.
Yield to worst is the lowest yield that can be realized by either calling or putting on one of the available call/put dates or holding a bond to maturity.
Par value, also known as face value, is the amount of money that a bond issuer agrees to repay to the purchaser at the bond's maturity.
The BVAL Municipal AAA Yield Curve (Callable) is populated with high quality US municipal bonds with an average rating of AAA from Moody's and S&P. The curve is a standard market scale with non-call yields up to year 10 and callable yields thereafter.
Bloomberg Municipal Bond Index is a market-value-weighted index designed to represent the long-term investment-grade tax-exempt bond market. This index is unmanaged, and its results include reinvested distributions but do not reflect the effect of sales charges, commissions, account fees, expenses or U.S. federal income taxes.
Bloomberg U.S. Corporate Investment Grade Index represents the universe of investment grade, publicly issued U.S. corporate and specified foreign debentures and secured notes that meet the specified maturity, liquidity, and quality requirements. This index is unmanaged, and its results include reinvested distributions but do not reflect the effect of sales charges, commissions, account fees, expenses or U.S. federal income taxes.
S&P 500 Index is a market capitalization-weighted index based on the results of approximately 500 widely held common stocks. This index is unmanaged, and its results include reinvested dividends and/or distributions but do not reflect the effect of sales charges, commissions, account fees, expenses or U.S. federal income taxes.
The S&P 500 Index is a product of S&P Dow Jones Indices LLC and/or its affiliates and has been licensed for use by Capital Group. Copyright © 2023 S&P Dow Jones Indices LLC, a division of S&P Global, and/or its affiliates. All rights reserved. Redistribution or reproduction in whole or in part are prohibited without written permission of S&P Dow Jones Indices LLC.
© 2023 Morningstar, Inc. All rights reserved. The information contained herein: (1) is proprietary to Morningstar and/or its content providers; (2) may not be copied or distributed; and (3) is not warranted to be accurate, complete or timely. Neither Morningstar nor its content providers are responsible for any damages or losses arising from any use of this information. Past performance is no guarantee of future results.
Institutional investors rely on our newsletter. Have you subscribed?
Our latest insights
-
-
-
-
-
Interest Rates
Municipal bonds: Positioning portfolios for the year ahead
RELATED INSIGHTS
-
Long-Term Investing
-
Federal Reserve
-
Markets & Economy
Don’t miss out
Get the Capital Ideas newsletter in your inbox every other week
 Chad Rach
 Mark Marinella
 Courtney Wolf