Economic Indicators
Categories
Interest Rates
Amid an economic boom, how high can rates go?
 Pramod Atluri
 Darrell Spence
April 14, 2021
The possibility of an economic boom this year has stoked worries about higher inflation and prompted a sharp selloff in U.S. Treasuries. We spoke with fixed income portfolio manager Pramod Atluri and U.S. economist Darrell Spence about the outlook for the economy and interest rates, and whether the market could force the Federal Reserve to tighten monetary policy sooner than expected.
What’s behind the current expectations, and how fast do you think the U.S. economy can grow in 2021?
Darrell Spence: It’s all about the stimulus. The $1.9 trillion coronavirus relief package, which sends more than $400 billion directly to consumers, should provide a powerful tailwind for growth. All of that money hitting the economy at once is powerful, and gross domestic product growth could be pretty spectacular. There are also unspent funds from prior relief packages, plus a vaccination timeline that currently puts the U.S. somewhere in the second half of August for achieving full vaccination of the over-16 population. As that timeline compresses, the economy should open further. Finally, the Fed has said it will view near-term inflation as transitory and remain accommodative.
I think all of this could drive a quarter or two of growth of around 10% this year. Supply chain bottlenecks and residual weakness in the labor market could be impediments to reaching that level, but high-single-digit growth is very likely in 2021.
We’re seeing many signs of economic acceleration. Look no further than the recent surge of U.S. consumer spending on pleasure boats. While some American families have saved their stimulus payments, as reflected in a savings rate close to 15%, others have essentially viewed them as a bonus. While purchases of pleasure boats is a signal of high-end spending, we’re starting to see a more broad-based increase in consumer spending as well.
High seas: U.S. consumer spending on pleasure boats soars
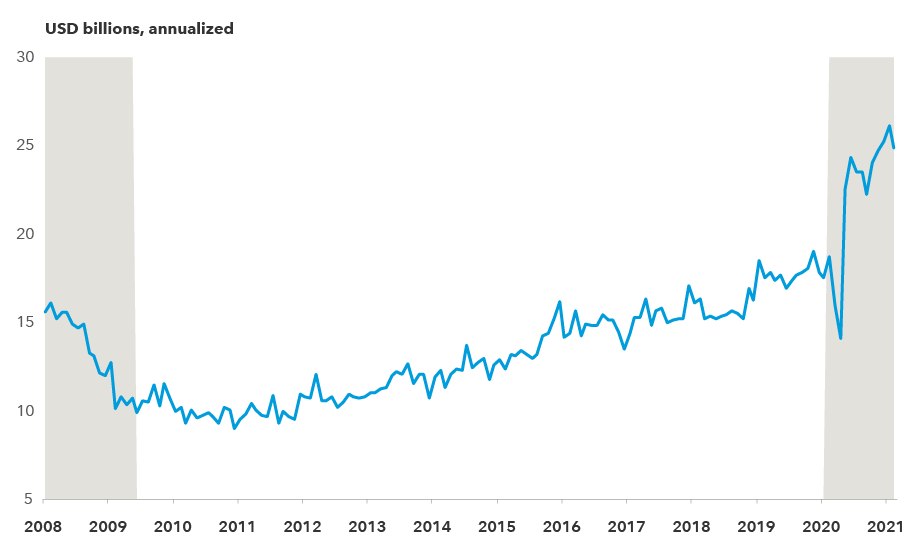
Source: Bureau of Economic Analysis, Refinitiv Datastream. As of February 28, 2021. Gray bars denote recessions as determined by the National Bureau of Economic Research.
Given the economic outlook, the market has grown concerned about inflation. Do you share that concern?
Spence: I agree with the consensus that inflation will rise this year, but a lot of that is likely to be temporary. We’ll be lapping last year’s super-low inflation, massive stimulus will be hitting the economy, and supply chain bottlenecks may drive some upward pricing pressure. I think we could see the consumer price index in the area of 2.5%.
These things will probably play out by the end of this year, and then inflation should get back to a longer-term trend rate. I don’t expect it to stage a major breakout. But it could persist a little bit higher over the longer term, especially if there is more fiscal support in the form of a large infrastructure bill.
It’s clear that the market is already sniffing this out. That's why TIPS (Treasury Inflation-Protected Securities) breakeven rates, which measure inflation expectations, are elevated. But inflation would have to really take off for expectations to rise meaningfully from here. At this point, a market pricing in 2.6% inflation doesn’t seem to be worrying the Fed.
5-year breakeven inflation rate hits highest level since 2008
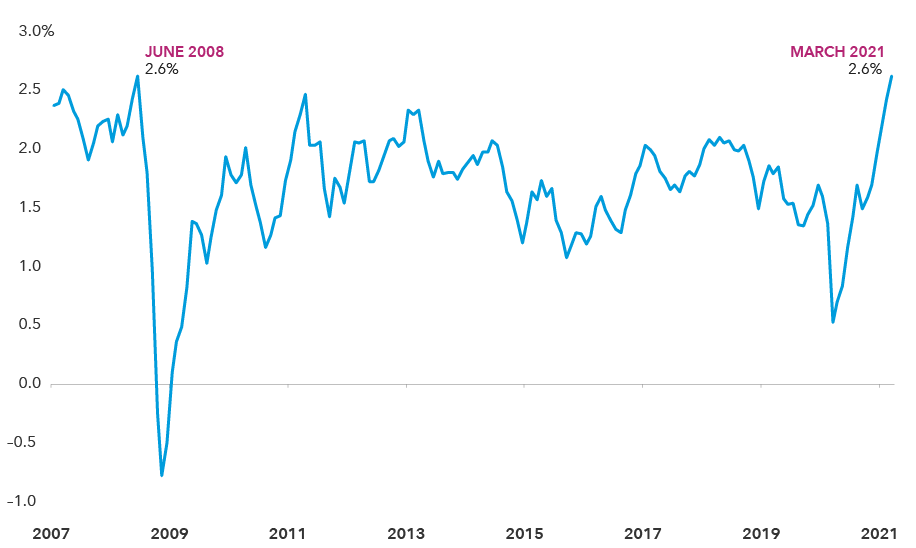
Source: Bloomberg. As of March 26, 2021.
Given this backdrop, where do you see interest rates moving over the next year?
Pramod Atluri: With the 10-year Treasury yielding almost 1.75%, interest rates at the long end of the curve are back to pre-pandemic levels — a time when U.S. growth and inflation were both trending at around 2%. That was a late-cycle economy that looked tired in many respects. Today, the economic environment is vastly different. So it makes sense to me that interest rates could move higher, although the bulk of the repricing has already occurred.
I’d say long rates could move higher by around 50 basis points, but it will be hard for them to move too high, too fast. Here’s why. First, there’s the Fed. By holding overnight interest rates close to 0% and promising to keep them there for years, the Fed is preventing the curve from moving significantly higher, particularly at the front end (less than seven years). Second, this effect is magnified by the Fed’s purchase of well over $1 trillion of securities per year. And third, there’s global interest rates. While the U.S. has a very positive growth and inflation outlook, other countries are still dealing head-on with the effects of COVID-19. With interest rates still low and even negative in many parts of the world, the U.S. should continue to attract international capital, which will weigh on U.S. rates.
How do you see the yield curve evolving?
Atluri: The yield curve has already steepened significantly, with the 10-year Treasury yield almost 125 basis points above the 2020 lows and the Fed pinning the short end near 0%. If growth and inflation reach the levels that Darrell suggests are possible, then 10- and 30-year Treasury yields may rise further, but shorter maturities will find it difficult to move higher.
At this point I’m finding value at the front end of the curve, such as the five-year maturity. At a yield of around 0.9%, it’s approaching my year-end target of 1%. The income generated from holding these bonds would significantly outweigh a move higher of 10 basis points. When you layer on the extra yield from investing in sectors such as corporate bonds and agency mortgage-backed securities, plus the benefit of falling yields as bond holdings get closer to maturity — what we call rolling down the curve — I think it is quite possible that short and intermediate fixed income securities could have positive low-single-digit total returns over the next year.
U.S. Treasury yield curve
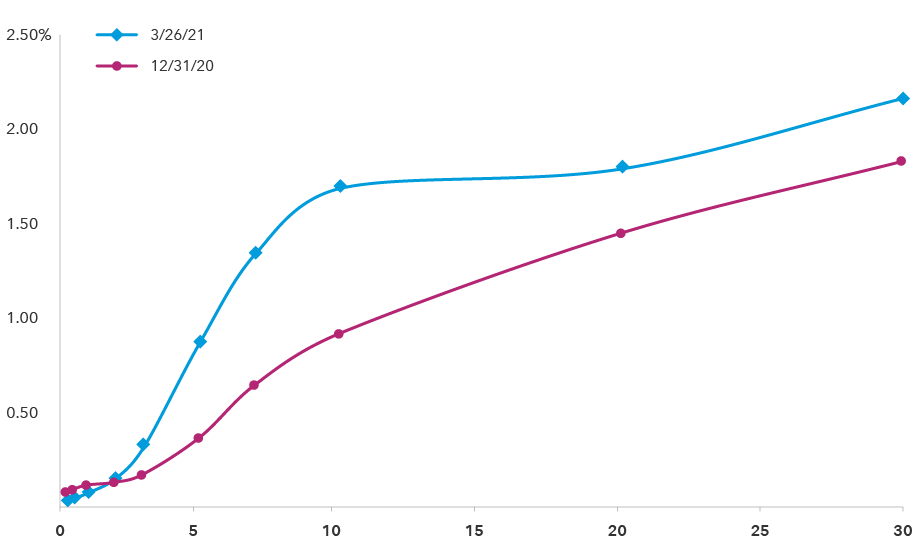
Source: Bloomberg. As of March 26, 2021.
In terms of monetary policy, could a stronger-than-expected economy force the Fed’s hand?
Atluri: The Fed will adjust policy based on actual employment and inflation outcomes, not on forecasts. So the key to understanding how fast the Fed will hike rates is how quickly growth picks up. If U.S. economic growth approaches 8%-10% instead of the consensus of 5.5% for 2021, this may accelerate the Fed’s timeline. The more growth you have, the faster we're going to hit the Fed’s targets, and the market is going to start pricing it accordingly.
My base case is that the Fed will begin to hike rates in early- to mid-2023 at a pace of 25 basis points every quarter, which is the same pace as the last hiking cycle. The Fed has signaled that it will taper asset purchases ahead of any rate hikes, so that implies a Fed taper in late 2022 or early 2023 — roughly two years from now.
U.S. Treasury yields rebound from 2020 lows
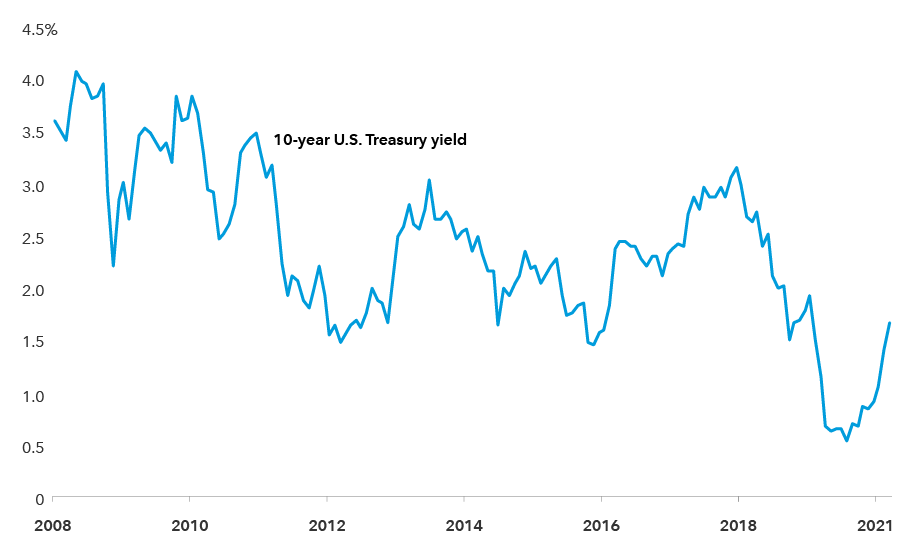
Source: Bloomberg. Shows U.S. Treasury yield to maturity on the last trading day of each month from January 2008 through February 2021. Data for March 2021 as of March 26, 2021.
How do you think the labor market might affect the Fed’s decision-making?
Spence: At 6.2% in February, the unemployment rate looks a lot better than it probably is under the surface. If you're out of the labor force, you’re not counted as unemployed. But we have to assume that a good chunk of those people would normally be employed — they dropped out because they had to care for kids who were at home, or for other reasons. So the true unemployment rate may be around 8%-8.5%. Overall, I think we’re around 6 million jobs below where we were before the pandemic. There's still a lot of lingering damage.
Now, it could go in the other direction quickly, but we need to see a broader and more sustained reopening, particularly in schools and things like that. In my view the jobs market is healing, but there’s a long way to go. Meanwhile, the Fed wants to see sustained improvement in the labor market and broad-based participation in the economy. All of this just makes me think it’s going to be slower to tighten.
What does all of this mean for bond investors?
Atluri: In an environment where longer rates rise by 50 basis points while the five-year Treasury yield remains around 1%, one might expect that a passive index bond fund could have a negative total return of –1% to –2% over the next year. However, active managers can do better than this.
For example, by focusing investments at the front end of the curve while avoiding or underweighting the long end, active managers with a duration of six years may be in position to maximize their gains and minimize their losses, leading to potentially better total returns. In fact, investors who are nervous about higher rates can do this themselves by shifting their fixed income allocation into short and intermediate bond funds that have a majority of their assets in the part of the curve that has already repriced and may be poised for positive total returns in 2021.
The flipside to higher rates is that they improve the ability of bond funds to diversify equity risk and provide downside protection in the event of another market correction. Even though asset valuations are high, there are many indications that markets are more fragile beneath the surface. It certainly seems plausible that the extreme liquidity provided by central banks has fueled massive speculation. If so, then investors need to be very careful to not overextend, which is why maintaining a high-quality fixed income allocation is as relevant today as it was in 2020. In the event of another significant shock that threatens the recovery, we could easily see interest rates fall significantly, which would push bond prices higher. In this situation, the fixed income allocation can provide ballast, capital preservation and liquidity to help cushion portfolios, just like it did during the COVID-19 shock of 2020.
Learn more about
Investments are not FDIC-insured, nor are they deposits of or guaranteed by a bank or any other entity, so they may lose value.
Investors should carefully consider investment objectives, risks, charges and expenses.
This and other important information is contained in the mutual fund prospectuses and summary prospectuses, which can be obtained from a financial professional and should be read carefully before investing.
Statements attributed to an individual represent the opinions of that individual as of the date published and do not necessarily reflect the opinions of Capital Group or its affiliates. This information is intended to highlight issues and should not be considered advice, an endorsement or a recommendation.
All Capital Group trademarks mentioned are owned by The Capital Group Companies, Inc., an affiliated company or fund. All other company and product names mentioned are the property of their respective companies.
Use of this website is intended for U.S. residents only.
Capital Client Group, Inc.
This content, developed by Capital Group, home of American Funds, should not be used as a primary basis for investment decisions and is not intended to serve as impartial investment or fiduciary advice.