Long-Term Investing
Categories
Bonds
High-yield bonds: 5 things to know today
 David Daigle
 Shannon Ward
 David Bradin
May 7, 2021
We recently asked high-yield portfolio managers David Daigle and Shannon Ward and fixed income investment director David Bradin for their perspectives on investing in the high-yield market against the backdrop of rising rates, historically tight spreads and a rebounding economy. We also discussed structural shifts in the asset class, as well as near-term challenges. Below are a few of their observations.
1. Credit quality has improved
The overall credit quality of the high-yield (BB/Ba and below) universe has improved significantly over a long period of time, and more acutely since 2019. Companies rated double-B, the highest rating assigned to a high-yield issuer, now represent more than half the market, up from around one third 20 years ago. On the flip side, triple-C-rated companies made up nearly one-quarter of the market at the height of the financial crisis in 2008–2009 but now account for just 13%.
The opposite holds true for investment-grade bonds. More than half of the market is rated triple-B, the lowest investment-grade rating. Consequently, there are a lot of companies massed around the dividing line between investment grade and high yield. That’s why there are a good number of crossovers: formerly investment-grade issuers — fallen angels — hitting high yield and rising stars moving up to investment grade. This widens the opportunity set for high-yield investors over a full cycle. And it illustrates the narrowing differentiation between the two markets, with high yield improving in quality and investment grade declining.
The COVID-19 crisis created a lot of fallen angels that we never would have had the opportunity to invest in before, because those companies were well ensconced in the investment-grade market. Ford is an example, as well as some of the airlines. These cyclical companies issued bonds with high-yield ratings and many had to pay very high coupons relative to the interest rates they would have had to borrow at in the investment-grade market. This would have made these bonds attractive to high-yield investors who could maintain a long-term perspective.
A higher quality high-yield market
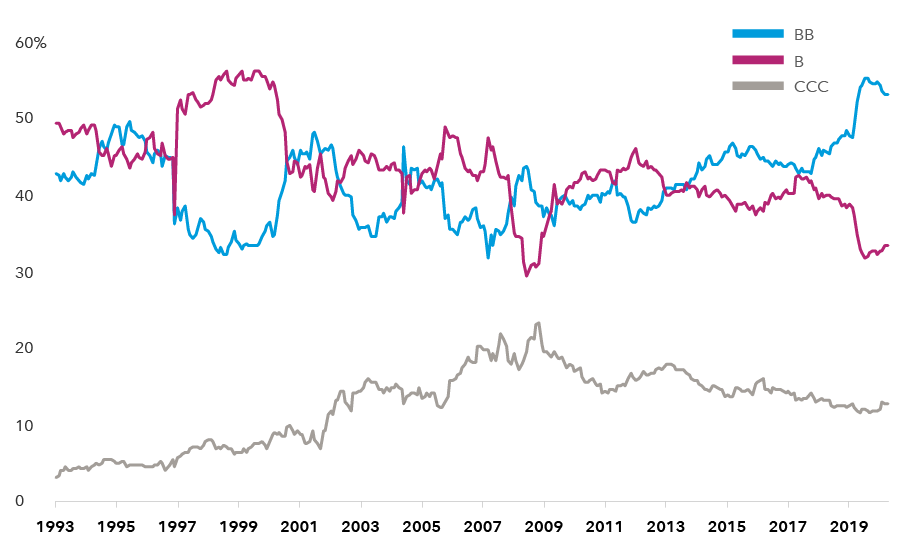
Source: Bloomberg Index Services Ltd. As of April 8, 2021. Figures reflect percentage of market value. Data excludes debt that is rated below CCC or is unrated. Bond ratings, which typically range from AAA/Aaa (highest) to D (lowest), are assigned by credit rating agencies such as Standard & Poor's, Moody's and/or Fitch as an indication of an issuer's creditworthiness.
To understand these shifts in credit quality, we like to think of the high-yield market as primarily composed of three kinds of issuers.
First are the leveraged private equity issuers, who dominated the asset class a decade ago. These companies now prefer to borrow in the leveraged loan market, where borrowing terms and covenants have become increasingly more flexible for issuers. With the absence of these highly leveraged issuers, high yield has become relatively less risky but also lower yielding.
A second set of companies resides in high yield because they have struggled due to poor management or poor governance, and their credit ratings reflect these risks. These can be good investments depending on where high-yield investors fall in the capital structure and the price that they pay for the bonds.
Increasingly, the high-yield market is dominated by a third group of companies: sophisticated users of leverage. In many cases, they are high-yield issuers by choice because they think a double-B or single-B rating is the sweet spot for their financial profile. Many of them may temporarily boost leverage for business reasons, such as increased capital spending, acquisitions or stock buybacks. It’s not unusual for them to migrate between high yield and investment grade.
2. Default rates are declining
Prior to the onset of COVID-19, high-yield default rates were very low. Since peaking at around 14% at the height of the global financial crisis, they have generally remained below the historical annual average of around 3%, with the exception of the period around 2015–2016 when a collapse in the oil price drove a flurry of defaults in the energy sector.
While the default rate spiked again in 2020, it has already begun to recover. There are a couple of reasons for this. First, the quality of issuers has improved, helped in part by the entry of some very large fallen angels, including Ford, Occidental Petroleum and Kraft Heinz. Second, during the recent period of market stress, the Federal Reserve’s support via its bond-buying program provided a backstop to the market. This allowed issuers — even those most severely impacted by the economic conditions created by the response to the virus — to refinance maturing debt and issue new debt to sustain operations at reasonable interest rates. Some may question those policy choices, but whether you agree with them or not, they have provided support to credit markets broadly. Also, while there was an economic halt in the middle of last year, we came out of it reasonably quickly and are now in an economic boom, which is supportive of lower defaults.
3. Credit spreads are pricing in an economic recovery
The high-yield market has historically produced positive results through the cycle. High yield has done particularly well during periods of recovery and economic expansion — and we’re poised for significant growth right now. Issuers with stronger balance sheets may be able to increase capacity and grow their businesses, as well as access capital markets to refinance existing debt or fund capital spending. Companies with large debt loads may be in a good position to grow their businesses organically and reduce leverage.
The asset class has generally done best when the economy is coming off the bottom of a cycle and spreads are wide. Today, we are probably closer to late cycle in terms of credit spreads, with a lot of the good news already reflected. Following the high-yield market’s rally last year, its average yield is now around 4%, near the all-time low. But in this environment, if an investor can potentially capture a 4% yield with low default rates, it’s not a bad place to be.
4. The market has become more diverse
The high-yield asset class has undergone many structural changes that make it very different from the market that took off during the 1980s leveraged buyout boom, or even the market that we knew before the financial crisis a decade ago.
One big change is increased sector diversity. Telecommunications and media are still a big part of the market, and we as managers have significant investments in those areas. But they no longer dominate the high-yield market the way they once did. Further, there is a lot more depth within each sector.
Today, financials, commodities, health care, technology, retail and real estate have all become a bigger part of the market. So, cyclically sensitive sectors like retail, travel and materials, as well as the less economically sensitive areas such as health care, play a larger role in high yield. The high-yield market is now representative of the overall U.S. economy and not dominated by one or two sectors as it was in the past.
Issuance rises in volume and credit quality
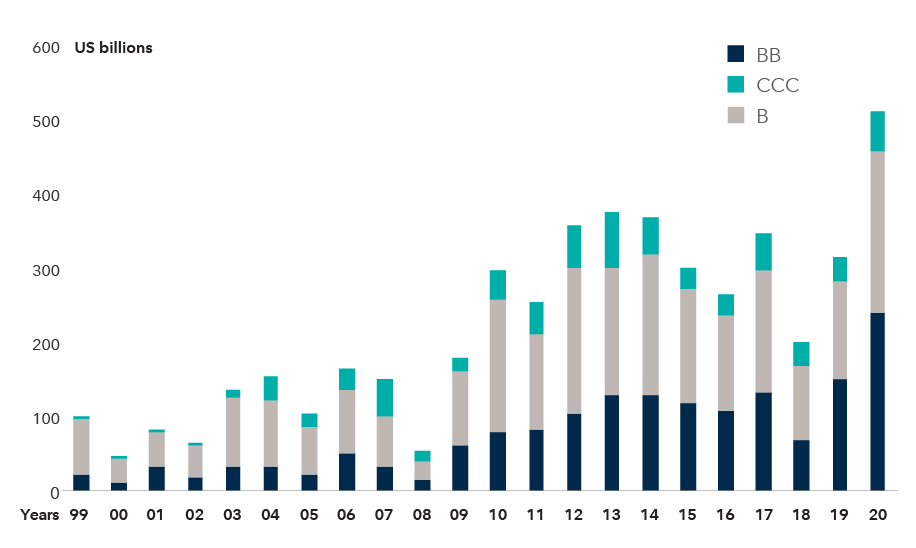
Source: BofA Global Research. As of December 31, 2020.
5. High yield is a short-duration asset class
The average duration of the high-yield market is about four years, compared with about eight years for investment-grade credit. (Duration measures the sensitivity of a bond’s price to a change in interest rates. A higher duration reflects greater sensitivity.) High-yield companies tend to issue debt in shorter maturities because they are lower rated and there is little market demand for long-duration issuance. In contrast, investment-grade companies have taken advantage of the low interest rate environment of the last decade and have extended the maturities of their debt, allowing them to lock in historically low funding costs.
As a result of high-yield debt’s shorter duration, it is less exposed to the higher interest rates that often come with very strong gross domestic product growth. That factor alone is supportive of the asset class relative to other areas of fixed income. It also creates an opportunity for diversification. Adding high-yield bonds to a portfolio can reduce its overall duration while providing the potential for appreciation during periods of economic expansion.
High yield, shorter duration
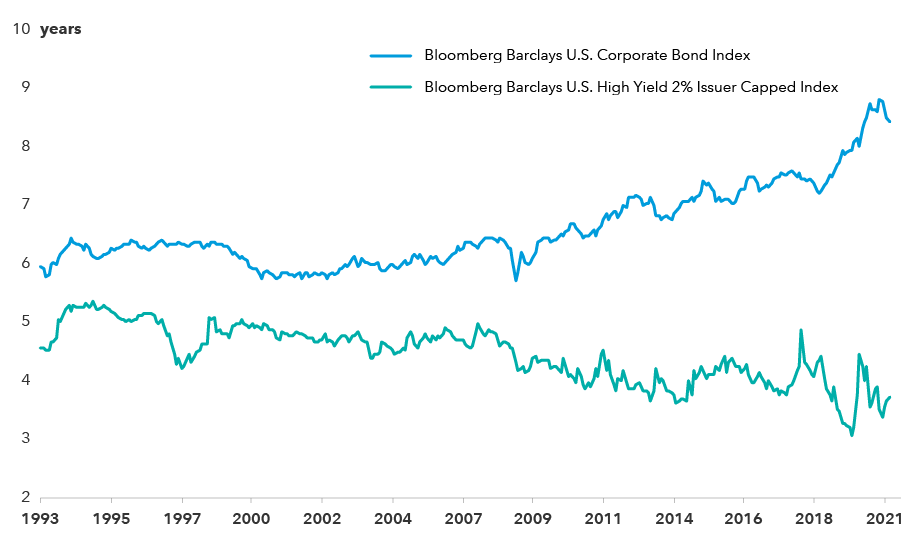
Source: Bloomberg Index Services Ltd. Data begins January 29, 1993, and ends March 31, 2021.
How we are investing in this market
The most prominent feature of late-cycle economies and markets is excessive risk-taking. We are seeing some of that in valuations across many asset classes. For high-yield investors, moving up in credit quality would be the easy response, but that would mean taking more interest rate risk.
On the other hand, one has to be careful about weaker credits in a late-cycle environment. If the economy or markets turn down, we don't want to be holding a bunch of economically sensitive, highly leveraged businesses that could come under pressure. But having too much safety and unnecessary insurance against risk that doesn’t materialize is costly. It's really a fine balancing act. As of April 2021, Capital’s high-yield portfolios are on average positioned about half a year short duration relative to the benchmark.
One sector of interest is commodities. If we experience a big economic rebound, it is desirable to be invested in commodities companies because they tend to be sensitive to the economic cycle. There are several good-quality commodity and materials companies in the high-yield universe.
Communications is another compelling sector. These companies tend to use credit markets extensively because they are capital intensive, but that capital intensity also creates real asset value. If anything goes wrong, the company can still exist even if it has to recapitalize. We’ve seen the sector go through a maturing process, much as energy did. Some of the leveraged weaker businesses have gone bankrupt, and some have cycled through a bankruptcy and recapitalization. The companies that remain are stronger. They have reinforced their balance sheets, improved their credit ratings, and some of them have the potential to migrate to investment grade.
Our approach is to invest company by company and security by security. We manage portfolios with a careful eye to maintaining diversity across sectors, risk profiles and maturities.
Learn more about
Bond ratings, which typically range from AAA/Aaa (highest) to D (lowest), are assigned by credit rating agencies such as Standard & Poor's, Moody's and/or Fitch, as an indication of an issuer's creditworthiness. If agency ratings differ, the security will be considered to have received the lowest of those ratings, consistent with the fund's investment policies. Securities in the Unrated category have not been rated by a rating agency; however, the investment adviser performs its own credit analysis and assigns comparable ratings that are used for compliance with fund investment policies.
Higher yielding, higher risk bonds can fluctuate in price more than investment-grade bonds, so investors should maintain a long-term perspective.
Statements attributed to an individual represent the opinions of that individual as of the date published and do not necessarily reflect the opinions of Capital Group or its affiliates. This information is intended to highlight issues and should not be considered advice, an endorsement or a recommendation.
Bloomberg® is a trademark of Bloomberg Finance L.P. (collectively with its affiliates, “Bloomberg”). Barclays® is a trademark of BarclaysBank Plc (collectively with its affiliates, “Barclays”), used under license. Neither Bloomberg nor Barclays approves or endorses this material, guarantees the accuracy or completeness of any information herein and, to the maximum extent allowed by law, neither shall have any liability or responsibility for injury or damages arising in connection therewith.
The Bloomberg Barclays U.S. Corporate Bond Index measures the investment-grade, fixed-rate, taxable corporate bond market. It includes U.S. dollar-denominated securities publicly issued by U.S. and non-U.S. industrial, utility and financial issuers.
Bloomberg Barclays U.S. Corporate High Yield 2% Issuer Capped Index covers the universe of fixed-rate, non-investment-grade debt. The index limits the maximum exposure of any one issuer to 2%. This index is unmanaged, and its results include reinvested distributions but do not reflect the effect of sales charges, commissions, account fees, expenses or U.S. federal income taxes.
Investments are not FDIC-insured, nor are they deposits of or guaranteed by a bank or any other entity, so they may lose value.
Investors should carefully consider investment objectives, risks, charges and expenses.
This and other important information is contained in the mutual fund prospectuses and summary prospectuses, which can be obtained from a financial professional and should be read carefully before investing.
Statements attributed to an individual represent the opinions of that individual as of the date published and do not necessarily reflect the opinions of Capital Group or its affiliates. This information is intended to highlight issues and should not be considered advice, an endorsement or a recommendation.
All Capital Group trademarks mentioned are owned by The Capital Group Companies, Inc., an affiliated company or fund. All other company and product names mentioned are the property of their respective companies.
Use of this website is intended for U.S. residents only.
Capital Client Group, Inc.
This content, developed by Capital Group, home of American Funds, should not be used as a primary basis for investment decisions and is not intended to serve as impartial investment or fiduciary advice.
This report, and any product, index or fund referred to herein, is not sponsored, endorsed or promoted in any way by J.P. Morgan or any of its affiliates who provide no warranties whatsoever, express or implied, and shall have no liability to any prospective investor, in connection with this report. J.P. Morgan disclaimer: https://www.jpmm.com/research/disclosures.
Investing outside the United States involves risks, such as currency fluctuations, periods of illiquidity and price volatility. These risks may be heightened in connection with investments in developing countries.