Economic Indicators
Categories
Bonds
5 core bond portfolio ideas for 2023
 Pramod Atluri
January 19, 2023
The past year was one of the most challenging on record for fixed income investors, as accelerating inflation, rising rates and widening credit spreads weighed on bond portfolios. But looking ahead, I see a much brighter future for fixed income. The macro environment and valuations have completely changed over the past 12 months and may contribute to strong results for high-quality core bond portfolios in the year ahead.
If the overarching theme for 2022 was high inflation and a hawkish Fed, I believe 2023 will bring falling inflation and slower growth that will end the global tightening cycle. I expect a lot of money that left the bond market in 2022 should come back, given today’s more attractive starting yields. This should provide a tailwind to the asset class.
A soft landing is achievable
To be clear, the fight to restore price stability is not over, but more and more signs show inflation in the U.S. has peaked and is falling quickly. After reaching a 40-year high of 9.1% in June 2022, the Consumer Price Index (CPI) decelerated for five consecutive months to 7.1%. If this trend persists and economic growth continues to weaken, I expect the Federal Reserve will no longer need to singularly focus on fighting inflation at all costs. I believe we will see the rate hiking cycle come to an end in the first half of 2023, as the Fed pivots to a policy stance that balances fighting inflation with supporting growth.
U.S. inflation has fallen quickly
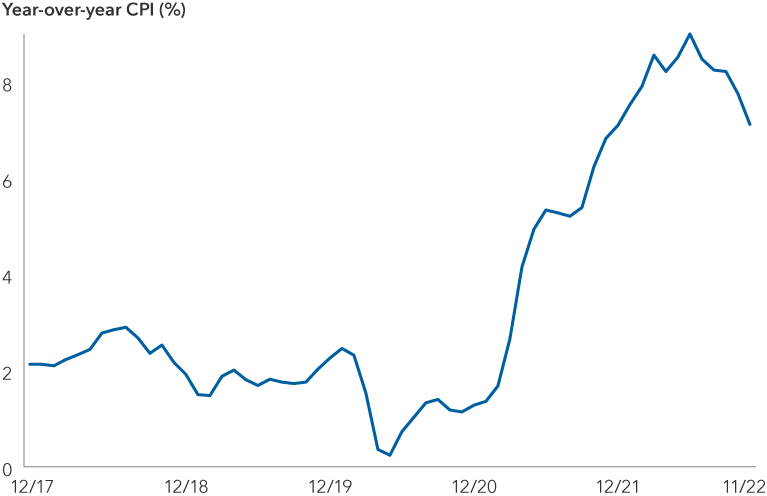
Sources: Bureau of Labor Statistics, FactSet. As of November 30, 2022. Consumer Price Index (CPI), a commonly used measure of inflation, measures the average change over time in the prices paid by consumers for a basket of goods and services.
As the market wakes up to the possibility of this enormous shift, Treasury yields have already begun falling, declining 30 basis points (bps) since October, lifting bond prices and improving total returns of the Bloomberg U.S. Aggregate Bond Index by nearly 3%. In the very near term, I think rates could move modestly higher as the fixed income market reopens and bond supply increases. But overall, I believe interest rates will drop by the end of 2023.
U.S. bonds rallied in late 2022
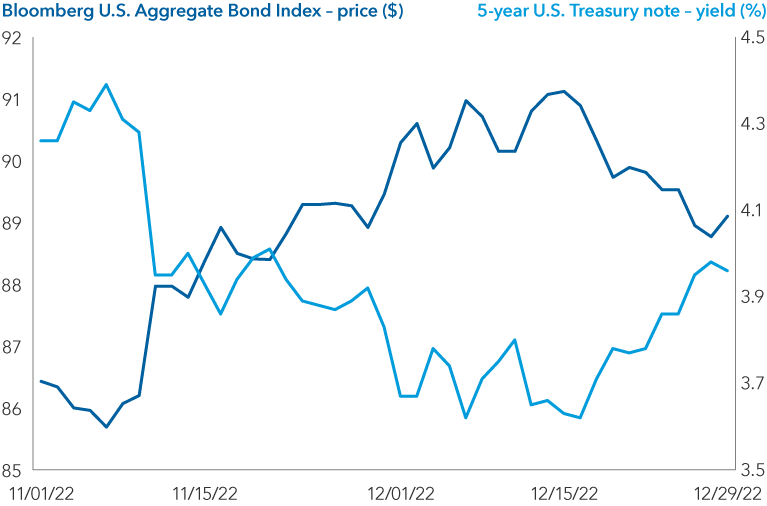
Sources: Capital Group, Bloomberg, FactSet. As of December 29, 2022. Past results are not predictive of results in future periods.
While my global economic outlook remains conservative, I’m much less worried about a deep recession than I was six months ago. Europe has weathered massive disruption from the war in Ukraine far better than expected, maintaining positive GDP growth while reducing dependence on Russian energy supplies. China has stunned the world by abruptly reversing course on its zero-COVID policy and rolling out additional economic support initiatives. While a significant health crisis in the first quarter is likely as COVID rapidly spreads through the country, my view of the latter half of 2023 is much more positive than it once was.
In the U.S. I expect to see some weakness from consumer spending as people run through the last of their COVID stimulus-related savings. But the strength of the job market and the remarkable resiliency of the U.S. economy have surprised me. If inflation trends down, allowing the Fed to end rate hikes in early 2023, I believe there is a path to a soft landing.
Many of the components of inflation have already begun to decline, and owners’ equivalent rent, which has remained persistently high, is expected to weaken by the end of the year. Wages have been rising steadily, which increases the risk that high inflation is becoming embedded in the economy. But as the chart below shows, U.S. workers’ average hourly compensation suggests wage growth could soften. By this metric, pay increases have begun rapidly decelerating, and historical data suggests inflation could roll over to 4% or lower in 2023.
As wages ease, so should inflation
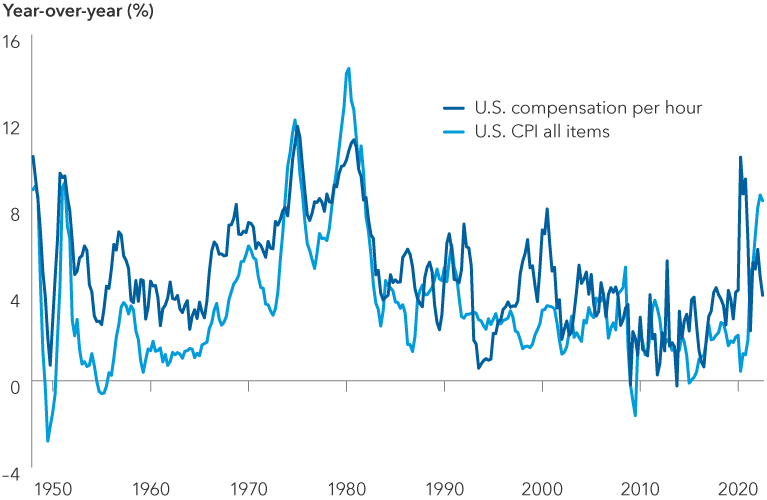
Sources: Capital Group, Bureau of Labor Statistics, Haver Analytics. As of December 31, 2022.
If we do enter a prolonged period of economic decline in 2023, it will be the best-telegraphed recession I can remember. From my vantage point, companies that struggled to hire workers in 2022 enter this potentially weak period with a much better cost structure than they did in previous recessions. Advance warning led many companies to proactively reduce costs heading into the new year. This may ultimately reduce the length and severity of a downturn in 2023, because there should be less need to overcorrect to match potential falling demand.
When you combine this backdrop with higher yields and wider credit spreads as a starting point, I believe fixed income is poised for strong total returns in 2023. Here are five themes that I believe could most influence the core bond strategies that I manage.
1. Lock in higher rates for longer
My base case for 2023 is that the Fed will raise its target rate to around 5% by midyear. If my forecast for falling inflation comes to pass, we could end the year with inflation around 4% and the federal funds rate at 5%. That would make for a positive (+1%) real monetary policy rate, which should be sufficient to continue pressuring inflation lower. If inflation continues to fall to 3% or lower, the Fed should be able to reduce rates commensurately to keep real rates at around +1%.
A path to positive real interest rates
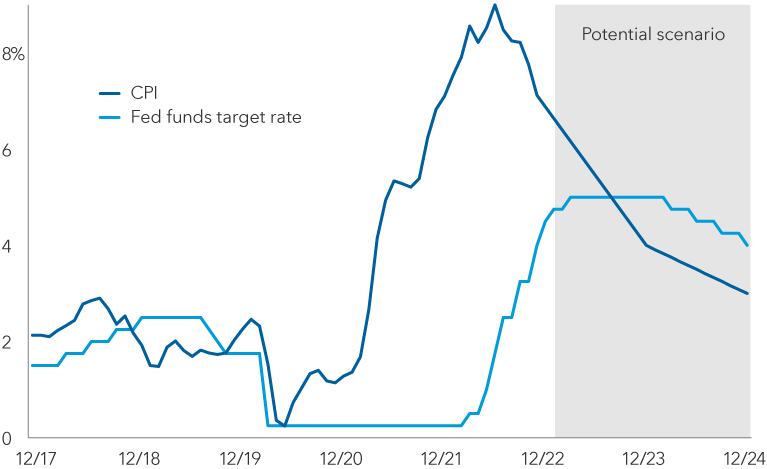
Sources: Author’s forecast, Bureau of Labor Statistics, U.S. Federal Reserve, FactSet. As of December 31, 2022.
As the market gets more comfortable with the direction of inflation in the face of weaker growth, I believe this will keep a lid on interest rates and may even push them lower amid the rising probability of a more dovish policy path.
With yields on cash alternatives like some short-term Treasury bills and commercial paper above 4.5%, and starting yields on the Bloomberg U.S. Aggregate Bond Index also around 4.5%, some investors may choose to own cash over bonds. But I disagree. If rates fall by the end of the year, which I think they will, the returns on floating rate cash alternative products may also fall, lowering their total return. Meanwhile, lower yields actually benefit investors in longer duration fixed income, because lower yields push bond prices higher. Thus, in my view, investors should consider moving out of cash and lock in today’s higher starting yields while simultaneously setting themselves up for potentially greater total returns if yields do fall.
2. Position for a steeper yield curve
Entering 2023, the yield curve was significantly inverted (with short-term bonds yielding more than long-term bonds) due to the Fed’s unwavering focus on restoring price stability, which led the market to push yields of short-duration bonds much higher. Two-year Treasury yields began 2022 at 0.79% and ended the year 363 bps higher at 4.42%. In contrast, yields on 30-year Treasuries started 2022 at 2.02% and ended 195 bps higher at 3.97%.
The short end of the curve responds primarily to changes in the monetary policy rate, while the long end also incorporates a view that higher rates in the short term will lead to lower growth, lower inflation and ultimately lower rates in the future. For the yield curve to invert further from here, inflation would need to re-accelerate, leading the Fed to abandon plans for a pause and maintain an aggressive hiking path that would likely push the economy into a deeper recession.
A hawkish Fed leads to inverted yield curve
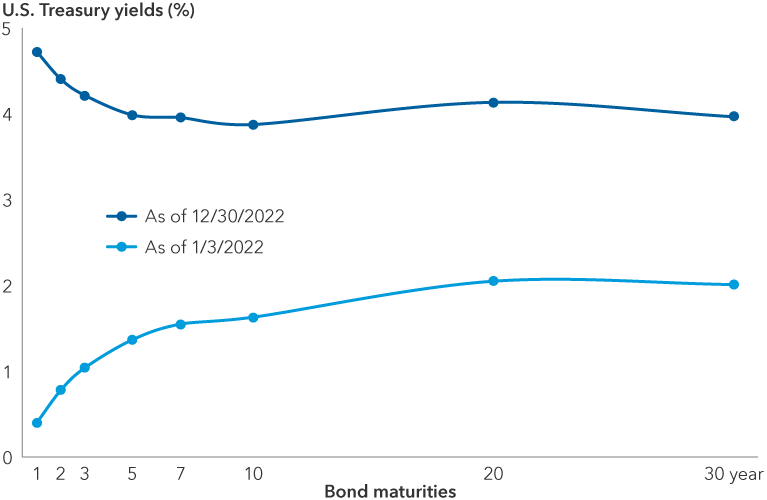
Sources: Capital Group, FactSet. As of December 31, 2022.
Yield curve inversions are an important market signal and are one of the primary components of most recession probability models. But if I’m right about inflation, and the Fed pauses and ultimately reduces rates in the coming 12 to 24 months, I believe this will lead to outperformance in the so-called “belly” of the yield curve (around five years). It would also eliminate the curve inversion, potentially leading to a much steeper curve in the years to come.
A severely inverted yield curve rarely lasts long
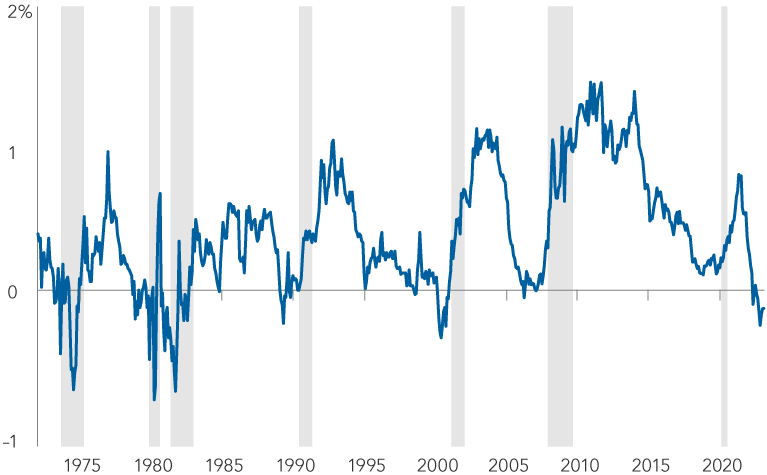
Sources: Capital Group, FactSet. As of December 31, 2022. Chart shows the difference between the 10-year and five-year U.S. Treasury yields from December 31, 1971, to December 31, 2022. A negative value indicates an inverted yield curve. Shaded areas represent U.S. recessions (defined as “a significant decline in economic activity that is spread across the economy and that lasts more than a few months”) as determined by the National Bureau of Economic Research.
3. Look for greater upside in agency mortgages
Agency mortgage-backed securities (MBS), which make up more than a quarter of the Bloomberg U.S. Aggregate Bond Index, had a particularly challenging 2022, but I see numerous reasons to expect a rebound.
As a response to the COVID-19 crisis, the Fed bought more than $1 trillion of agency MBS to ease monetary policy and support a deeply shocked economy. This action in combination with others led yields to fall, mortgage durations to shrink, interest rate volatility to plummet and spreads to reach negative territory.
By the end of 2022, all that had changed. The Fed’s hiking campaign and the fear that the central bank would offload MBS from its balance sheet led rates to rise, mortgage durations to extend, interest rate volatility to increase and spreads on agency MBS to reach some of the widest levels against Treasuries since the global financial crisis of 2008. In my view, each of the factors that led agency MBS to significantly underperform in 2022 are reasons to consider owning MBS in 2023.
Given how weak the housing market has become, along with the weaker path for growth and inflation, it seems unlikely the Fed will move to sell more agency MBS into the market. As this risk is priced out of the market, agency MBS valuations should improve.
Additionally, as the path for inflation and monetary policy becomes clearer, I expect interest rate volatility to taper off, which could further benefit MBS valuations. Mortgage valuations have typically improved when interest rate volatility falls, because agency mortgage borrowers in the U.S. have an option to repay their loans early. When rate volatility falls, the early payment option becomes less valuable to borrowers and the value accrues to mortgage investors.
With AAA-rated agency mortgage yields beginning the year around 80 to 100 bps above Treasuries, valuations are now very attractive, particularly given the very high quality and liquidity of the sector.
As for other asset-backed sectors, such as credit cards and auto loans, I tend to hold more senior securities in the portfolios I manage and have pretty good conviction that these assets should be robust going into a downturn. However, they are shorter duration by nature, and aligning with my views above, I would prefer to deploy money into sectors with an opportunity to lock in more attractive yields for longer.
Commercial real estate is one sector where I remain cautious on the fundamentals and am not expecting to add in 2023. There is still an uncertain outlook post-COVID in terms of occupancy, and many properties are now refinancing at much higher rates.
4. Wait for economic clarity on credit
I expect credit to be additive as the year goes on, but I plan to wait to increase my allocations until there is greater clarity on the economic picture. Valuations in credit have rebounded as investors have started to price in a short and shallow downturn, leaving little cushion should the outlook deteriorate. To be comfortable adding investment-grade credit (BBB/Baa and above) at today’s prices, I want to see evidence that consumer strength is holding up and inflation is falling.
High-yield bonds look like decent value with index yields hovering around 8.5%, which should provide adequate compensation for risk, as I expect the speculative-grade default rate in the U.S. to rise from a very low 1.7% to 4% to 5% in a moderate downturn.
High-yield bonds look more attractive
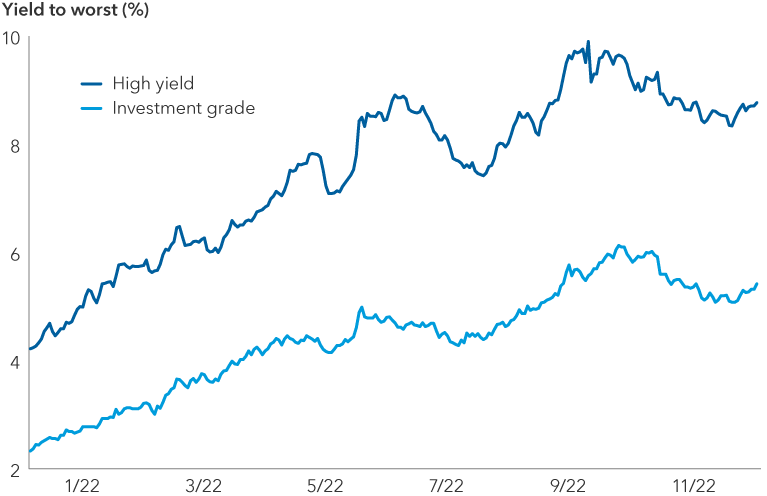
Sources: Capital Group, FactSet. As of December 27, 2022. YTW = yield to worst. High yield = Bloomberg U.S. Corporate High Yield 2% Issuer Capped Index. Investment grade = Bloomberg U.S. Corporate Investment Grade Index.
In perhaps the biggest change to my outlook from last year, I see significant potential upside in emerging markets (EM). In 2022, a strong dollar and a hawkish Fed were a terrible combination for EM. In contrast, scenarios where the Fed is more accommodative and the dollar is weakening have been fantastic for EM returns in the past. When combined with very attractive starting valuations, I think the outlook for EM could be quite positive. But this is predicated on my belief that inflation will fall and economic weakness in 2023 will be short and shallow. This view still has a lot of risk, because the outlook remains uncertain, and volatility in emerging markets can be quite high.
Because the conservative role of core bond portfolios is different from that of a pure EM portfolio, I think it is prudent for core bond investors to remain cautious about adding EM until we know for sure that we are not heading for a deeper recession. If the outlook for growth gets worse, spreads should widen, which may offer an opportunity to invest in EM with a greater margin of certainty.
5. Expect positive correlations to continue for now
Until inflation comes down, I expect the correlation between interest rates and risky assets like corporate bonds to remain positive. But unlike last year, when the returns of both interest rates and risky assets worked against investors, I expect both to be additive to performance by the end of the year.
Elevated inflation alters stock-bond correlations
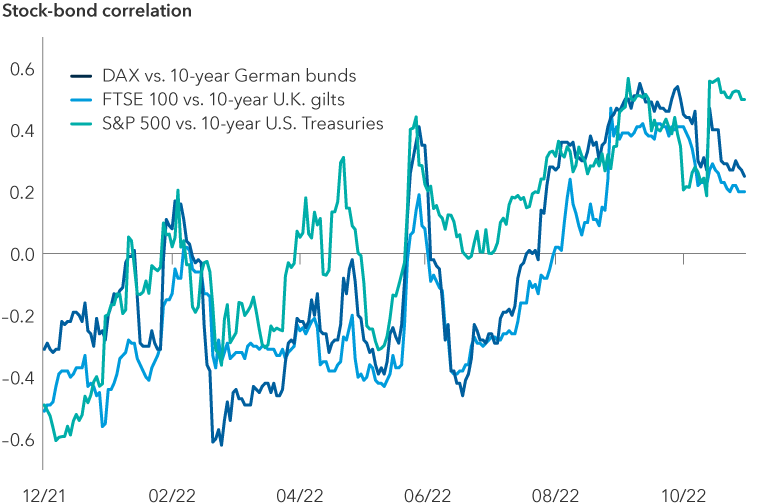
Sources: Capital Group, Bloomberg. As of November 30, 2022. Chart shows stock-bond correlations between major equity indexes for the U.S. (S&P 500), Germany (DAX) and U.K. (FTSE 100) and their respective country’s 10-year government bonds from December 1, 2021, to November 30, 2022.
When inflation is low, as it was over the last couple of decades, central banks can focus on supporting growth and can lower interest rates to offset shocks to risky assets. That dynamic creates a nice negative correlation between fixed income and risky assets where rates fall, leading bond prices to rise as a response to economic shocks. But when inflation is too high, like it has been over the past year or so, central banks are constrained and cannot lower rates in response to economic shocks. And in the case of last year, central bank hawkishness itself was the primary source of market volatility, leading bond prices and risky asset valuations to fall at the same time.
As inflation comes down, investors should expect today’s positive correlation to diminish. But to revert all the way from a positive correlation back to negative, I think inflation needs to get back down to 3% or lower, which is still probably a couple of years down the line. This year, I think high-quality core bond portfolios should generate decent returns, and risky assets should also hold up well.
The bottom line for bond investors
As we enter 2023, I believe the asset class looks better than it has for more than a decade.
With starting yields of roughly 5% for high-quality core and 8.5% for high-yield bonds, investors today can create a portfolio with mid to high single-digit starting yields and less than half the expected volatility of equities. In addition, the portfolio will potentially do better if growth falls faster, providing a significant offset to other risky assets, with even more upside potential from active management. This has the potential to be an attractive package for many investors and should lead to a much more positive outlook for fixed income in 2023.
Learn more about
Correlation is a statistical measure of how a security and an index move in relation to each other. A correlation ranges from –1 to 1. A positive correlation close to 1 implies that as one moves, either up or down, the other will move in “lockstep,” in the same direction. A negative correlation close to –1 indicates the two have moved in opposite directions.
A credit spread is the difference in yield (the expected return on an investment over a particular period of time) between a government bond and another debt security of the same maturity but different credit quality. Credit spreads typically measure the perceived riskiness of a corporate bond relative to a safer investment, typically the equivalent government bond; the wider the spread, the riskier the corporate bond. A period of widening (increase in the spread) reflects an increase in this perceived credit riskiness. The value of fixed income securities may be affected by changing interest rates and changes in credit ratings of the securities.
Duration is a measure of the approximate sensitivity of a bond portfolio's value to interest rate changes.
Yield to worst is the lowest yield that can be realized by either calling or putting on one of the available call/put dates or holding a bond to maturity.
Bloomberg U.S. Aggregate Bond Index represents the U.S. investment-grade fixed-rate bond market. This index is unmanaged, and its results include reinvested dividends and/or distributions but do not reflect the effect of sales charges, commissions, account fees, expenses or U.S. federal income taxes.
Bloomberg U.S. Corporate High Yield 2% Issuer Capped Index covers the universe of fixed-rate, non-investment-grade debt. The index limits the maximum exposure of any one issuer to 2%. This index is unmanaged, and its results include reinvested distributions but do not reflect the effect of sales charges, commissions, account fees, expenses or U.S. federal income taxes.
The Bloomberg U.S. Corporate Investment Grade Index represents the universe of investment grade, publicly issued U.S. corporate and specified foreign debentures and secured notes that meet the specified maturity, liquidity, and quality requirements.
The S&P 500 Index is a market capitalization-weighted index based on the results of approximately 500 widely held common stocks.
London Stock Exchange Group plc and its group undertakings (collectively, the “LSE Group”). © LSE Group 2023. FTSE Russell is a trading name of certain of the LSE Group companies. “FTSE®” is a trademark of the relevant LSE Group companies and is used by any other LSE Group company under license. All rights in the FTSE Russell indexes or data vest in the relevant LSE Group company which owns the index or the data. Neither LSE Group nor its licensors accept any liability for any errors or omissions in the indexes or data and no party may rely on any indexes or data contained in this communication. No further distribution of data from the LSE Group is permitted without the relevant LSE Group company’s express written consent. The LSE Group does not promote, sponsor or endorse the content of this communication.
Investments are not FDIC-insured, nor are they deposits of or guaranteed by a bank or any other entity, so they may lose value.
Investors should carefully consider investment objectives, risks, charges and expenses.
This and other important information is contained in the mutual fund prospectuses and summary prospectuses, which can be obtained from a financial professional and should be read carefully before investing.
There have been periods when the results lagged the index(es) and/or average(s).
The indexes are unmanaged and, therefore, have no expenses. Investors cannot invest directly in an index.
Source: Bloomberg Index Services Limited. BLOOMBERG® is a trademark and service mark of Bloomberg Finance L.P. and its affiliates (collectively "Bloomberg"). Bloomberg or Bloomberg's licensors own all proprietary rights in the Bloomberg Indices. Neither Bloomberg nor Bloomberg's licensors approves or endorses this material, or guarantees the accuracy or completeness of any information herein, or makes any warranty, express or implied, as to the results to be obtained therefrom and, to the maximum extent allowed by law, neither shall have any liability or responsibility for injury or damages arising in connection therewith.
Each S&P Index ("Index") shown is a product of S&P Dow Jones Indices LLC and/or its affiliates and has been licensed for use by Capital Group. Copyright © 2026 S&P Dow Jones Indices LLC, a division of S&P Global, and/or its affiliates. All rights reserved. Redistribution or reproduction in whole or in part is prohibited without written permission of S&P Dow Jones Indices LLC.
Statements attributed to an individual represent the opinions of that individual as of the date published and do not necessarily reflect the opinions of Capital Group or its affiliates. This information is intended to highlight issues and should not be considered advice, an endorsement or a recommendation.
All Capital Group trademarks mentioned are owned by The Capital Group Companies, Inc., an affiliated company or fund. All other company and product names mentioned are the property of their respective companies.
Use of this website is intended for U.S. residents only.
Capital Client Group, Inc.
This content, developed by Capital Group, home of American Funds, should not be used as a primary basis for investment decisions and is not intended to serve as impartial investment or fiduciary advice.