
Global Equities
Can international equities overcome a strong dollar?
 Steve Caruthers
 Steven Sperry
November 2, 2022
There’s no denying that the relentless rise of the U.S. dollar has been challenging for investors in international equities. The currency translation effect (that is, losses and gains resulting from the conversion of non-U.S. investment returns into U.S. dollars) has dented international and global equity portfolio results.
There are two ways currency movements can affect investors. In addition to translation effects at the portfolio level, companies within a portfolio may experience business impacts. However, a strong dollar is not always bad news for non-U.S. companies.
Specific companies with solid fundamentals can disproportionately benefit from foreign exchange swings. Exchange-rate volatility can have a big impact on corporate profitability, depending on where a company generates revenue or incurs costs. Companies with significant costs in euros or yen and a lot of revenue in U.S. dollars, for example, could be poised to benefit. In this environment, research is crucial to understanding how exchange-rate volatility can affect profitability. Ultimately, underlying company fundamentals should drive investment decisions rather than near-term currency fluctuations.
How strong is the U.S. dollar?
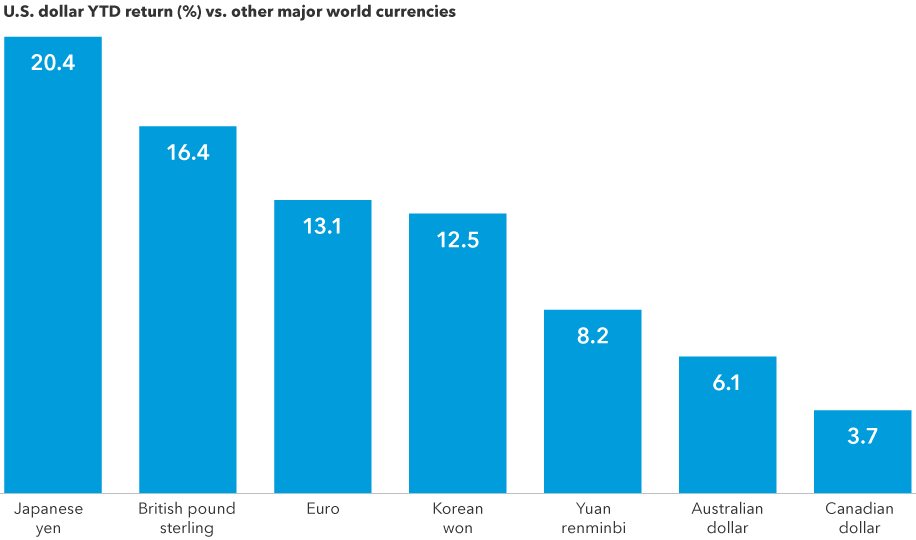
Sources: Capital Group, ICE Data Services, MSCI, RIMES. As of August 19, 2022.
Strong USD can cut both ways
In today’s global economy, it is common for multinational companies to have geographically diverse income sources, and manufacturing hubs and suppliers located across the world. For example, as of September 14, 2022, companies in the S&P 500 Index derive about 40% of their revenue from outside the United States. When the dollar is strong, this dynamic can put pressure on these companies’ profits, as the money coming in from abroad is not worth as much as it is when the dollar is weak.
The inverse can be true for non-U.S. companies, too. Multiple sectors within the MSCI Europe Index, for example, pull in significant U.S.-dollar-based revenue. Industries that might typically benefit from wide dispersion between the U.S. dollar and other currencies include autos, electronics, shipbuilders, machinery, aerospace and defense, and luxury goods.
Many non-U.S. companies have substantial U.S.-dollar-based revenue
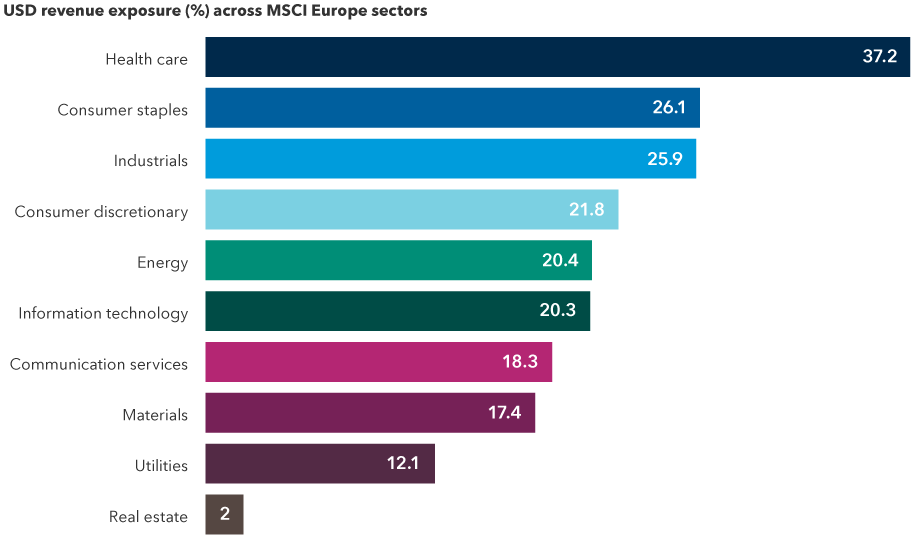
Sources: Capital Group, FactSet, Refinitiv Datastream. Revenue exposure above reflects the weighted average of the percentage of revenue generated in the United States across each index's respective constituents. Constituent lists are current as of August 23, 2022; company-level revenue exposure is estimated by FactSet and is current as of January 2022.
There are several competing factors that can drive profits beyond currency moves, and many companies hedge their currency exposures to help protect their balance sheets from unexpected swings. However, there are numerous examples of non-U.S. companies citing the strong dollar as being beneficial to their bottom line this year.
One is United Kingdom–based aerospace company BAE, which brings in about 47% of its revenue in dollars. On BAE’s most recent earnings call, executives explained that, “Should the current dollar (exchange) rate persist for the year, there will be a significant tailwind to reported results.” If the pound were to weaken another 10 cents against the dollar, the company estimates its underlying earnings before interest and taxes (EBIT) guidance could be retranslated upward by as much as 10%.
French consumer discretionary giant LVMH, which owns luxury goods maker Louis Vuitton, provides another compelling illustration of the positive impact a strong dollar can have on non-U.S. companies. In a recent shareholder presentation, LVMH (which counts about 27% of its revenue in dollars) noted that currency effects have boosted its profits by more than 400 million euros through the first half of 2022. Currency impact alone accounted for about 19% of its improvement in operating profit on a year-over-year basis.
Currency translation can boost earnings growth for select companies
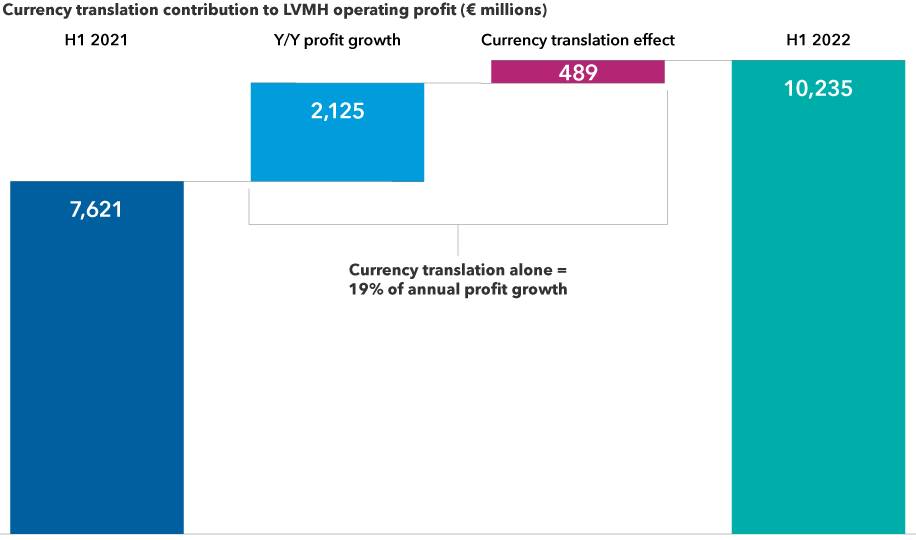
Sources: Capital Group, company filings. Periods above refer to the six-month fiscal periods ending June 30, 2021, and June 30, 2022, respectively.
French drugmaker Sanofi has also been a beneficiary of the strong dollar. It reported that currency effects boosted its sales by nearly 1 billion euros in the first half of 2022 and pushed its earnings per share up by 0.19 euros.
Dollar poised to stay strong
These factors are likely to be relevant for some time. According to Capital Group currency analyst Jens Sondergaard, the dollar is rising for good reason and may not yet be at its peak. As he explains, the U.S. economy is stronger than that of other major countries, and the U.S. Federal Reserve is aggressively tightening to blunt the impact of inflationary pressures.
In most other parts of the world, it’s a very different story. Outside the U.S., there has been lackluster growth, inflation that’s mostly driven by energy prices and severe compression of real wages. As a result, central banks are being forced into what Sondergaard characterizes as “bad” rate hikes.
The dollar’s ascent appears set to continue
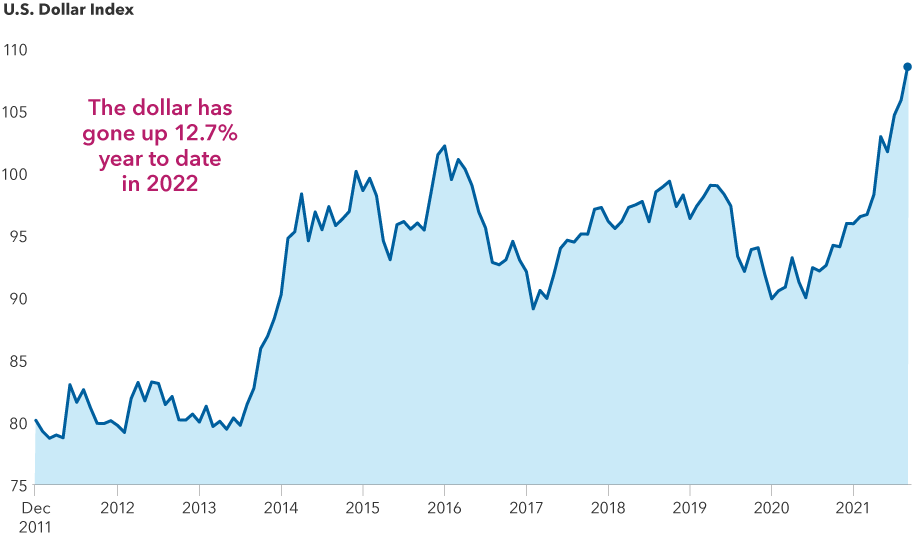
Sources: Capital Group, ICE Data Services, Refinitiv Datastream. Data as of July 29, 2022.
Bottom line
Active management can help discern which companies could benefit from a strong dollar. This year’s massive currency moves are creating tailwinds for certain companies, and the repercussions of an appreciating dollar can vary widely. In our view, research is key to assessing the likely effects of currencies on a specific firm’s prospects and its stock’s return potential.
Rising yields increase income potential for bonds
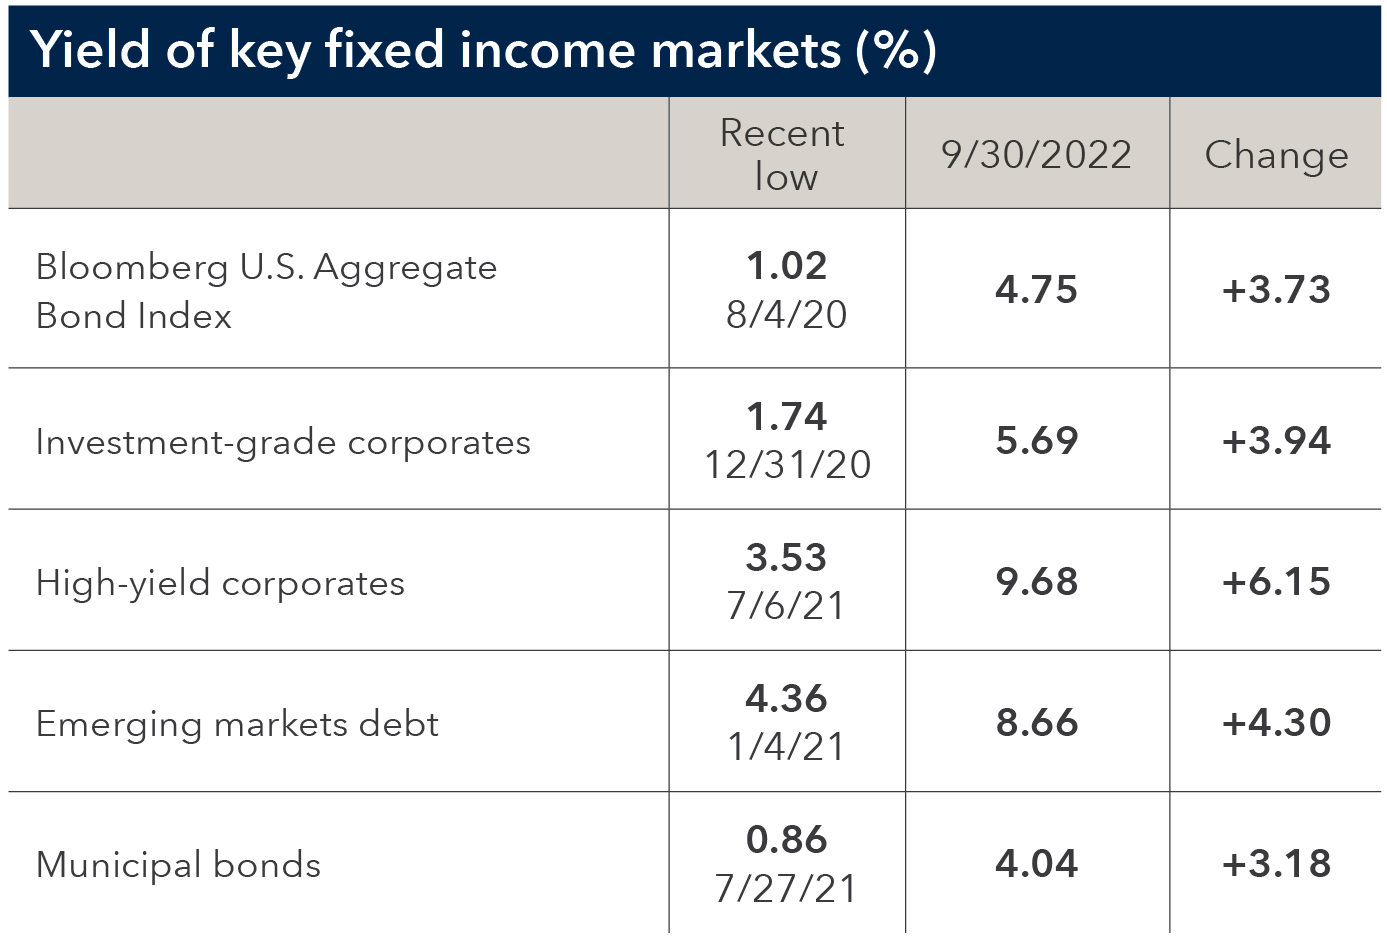
Sources: Bloomberg Index Services Ltd., JP Morgan. Investment-grade corporates represented by Bloomberg U.S. Corporate Investment Grade Index; high-yield corporates by Bloomberg U.S. Corporate High-Yield Index; emerging markets debt by a 50% JPMorgan EMBI Global Diversified Index/50% JPMorgan GBI-EM Global Diversified Index blend; and municipal bonds by Bloomberg Municipal Bond Index. Index returns are presented in US$. Indices are unmanaged and, therefore, have no expenses. Investors cannot invest directly in an index. Past performance is no guarantee of future results. Period covers January 1, 2020, to September 30, 2022. As of September 30, 2022.
Explore topics
S&P 500 Index is a market-capitalization-weighted index based on the results of 500 widely held common stocks.
The indexes are unmanaged and, therefore, have no expenses. Investors cannot invest directly in an index.
MSCI has not approved, reviewed or produced this report, makes no express or implied warranties or representations and is not liable whatsoever for any data in the report. You may not redistribute the MSCI data or use it as a basis for other indices or investment products.
Related Insights
Related Insights
-
-
Artificial Intelligence
-
Economic Indicators