Fixed Income What higher interest rates could mean for stocks and bonds

Bonds have been anything but boring this summer. With US Treasury yields climbing amid rising national debt, elevated inflation and massive AI-related investments, some investors are asking whether recent volatility signals a looming crisis or a broader shift to a world of higher interest rates.


“Rates are normalisng toward levels more consistent with long-term economic growth and inflation trends,” says John Queen, fixed income portfolio manager. “I don’t see an imminent crisis, but the adjustment process may bring periods of pain for investors along the way.”


“One reason Treasury yields are higher is because the US economy has shown resilience through years of rising interest rates,” Queen adds. “Importantly, AI-related companies extended their streak of blockbuster earnings, and many other sectors broadly delivered solid profits.”

A return to higher Treasury yields

A line chart showing U.S. long-term government bond yields from 1871 through August 2026. Yields were between 3% and 6% for 62% of the period, peaked near 14% in the early 1980s, fell below 1% in 2020 and rose to 4.7% by August 2026. An inset chart shows the 10-year Treasury yield at 4.75% and the federal funds rate at 3.50% as of August 2026. The 10-year Treasury security is currently yielding 4.75% and the federal funds rate remains at 3.50% in August 2026.

Sources: Capital Group, Federal Reserve Bank of St. Louis, LSEG Datastream, Robert Shiller. Data for 1871 to 1961 represents average monthly US long-term government bond yields compiled by Robert Shiller. Data for 1962 to 2026 represents 10-year Treasury yields as of 31 December each year within the period. Data for 2026 is as of 31 August 2026.

Inflation may settle above pre-pandemic lows


More than five years of above-target inflation has left many consumers wondering whether higher prices are the new normal. The US Personal Consumption Expenditures Price Index rose 3.7% in July from a year ago, while core PCE, which strips out food and energy and is the US Federal Reserve’s preferred inflation measure, increased 3.3%.


“The world has changed since the pandemic, and inflation is less likely to return to the persistently low levels that prevailed after the 2008 global financial crisis,” says Tom Hollenberg, fixed income portfolio manager. “But I do believe core PCE inflation will ease from current levels and settle closer to the 2% to 2.5% range.”

Inflation has not broadened despite higher energy prices

A stacked bar chart showing year over year PCE inflation contributions from housing, core services excluding housing, core goods, food and energy and total from January 2021 to July 2026.

Sources: Capital Group, Bureau of Economic Analysis, Federal Reserve Bank of San Francisco. Data labels shown are for the total year-over-year growth rate in the monthly Personal Consumption Expenditures (PCE) Price Index for all items as of January 2021 (start of period), June 2022 (peak) and July 2026 (latest reading). Latest data available as of 31 July 2026. Combined contributions across PCE buckets may may not sum to total in certain months due to rounding.

“Price increases for major drivers of inflation such as car insurance and shelter, including rent, have slowed and are now helping bring overall inflation down,” Hollenberg says. “That cooling trend should continue as the job market shows signs of softening, and many businesses are reluctant to push through price increases.”


Still, inflation remains a key risk for bond investors given the scale of AI-related investment. “If capex continues to rise and accelerates growth before AI-related productivity gains show up, inflation could move higher. Under that scenario, the Fed could feel more pressure to embark on a renewed hiking cycle, which could push the yield on the 10-year Treasury above 5%. It’s not my base case, but something I’m tracking closely.”


Fed returns to pre-crisis playbook


As rates and inflation normalise, US Federal Reserve Chair Kevin Warsh is embracing a communication strategy that relies less on forward guidance, echoing the Fed’s approach before the global financial crisis.


“I’m comfortable with the Fed making fewer promises about where rates will be six or 12 months from now, but investors still need to understand what evidence would change monetary policy,” Hollenberg says. “If I have no idea what could cause the Fed to raise or lower interest rates, I will likely demand more compensation to hold long-term bonds. This may ultimately be an iterative process where markets learn Warsh’s reaction function over time.”


Uncertainty about Warsh’s reaction function after the Fed kept rates steady at its July meeting put volatility on full display. The 30-year Treasury hit a 19-year high of 5.3% in August before receding on Treasury Secretary Scott Bessent’s surprise move to increase buybacks of long-dated Treasury securities.


“Bessent is signalling to the market that the Treasury Department may intervene if bond yields move above levels it believes are justified by the fundamentals,” Hollenberg explains. “They can do that to a certain extent, but there are limits. If Treasury pushed that strategy too far, it could become more difficult to sell bills to fund those bond purchases and ultimately risk undermining demand for dollar-denominated assets.”


As the Treasury market whipsawed, the US hit an alarming milestone: The national debt surpassed $40 trillion, roughly double the amount just 10 years ago. Queen notes that worries about US borrowing have been around for decades and remain a top question from investors.


“The idea that the US won’t repay its debt in a currency that it prints is unlikely. The real concern is whether people will continue to buy additional Treasuries. If they don’t, borrowing costs could rise further and pressure the government to reduce deficits,” Queen says. “While that is certainly possible, the US economy remains one of the strongest in the world, with a large and very liquid government bond market. These factors should help prevent a near-term debt crisis.”


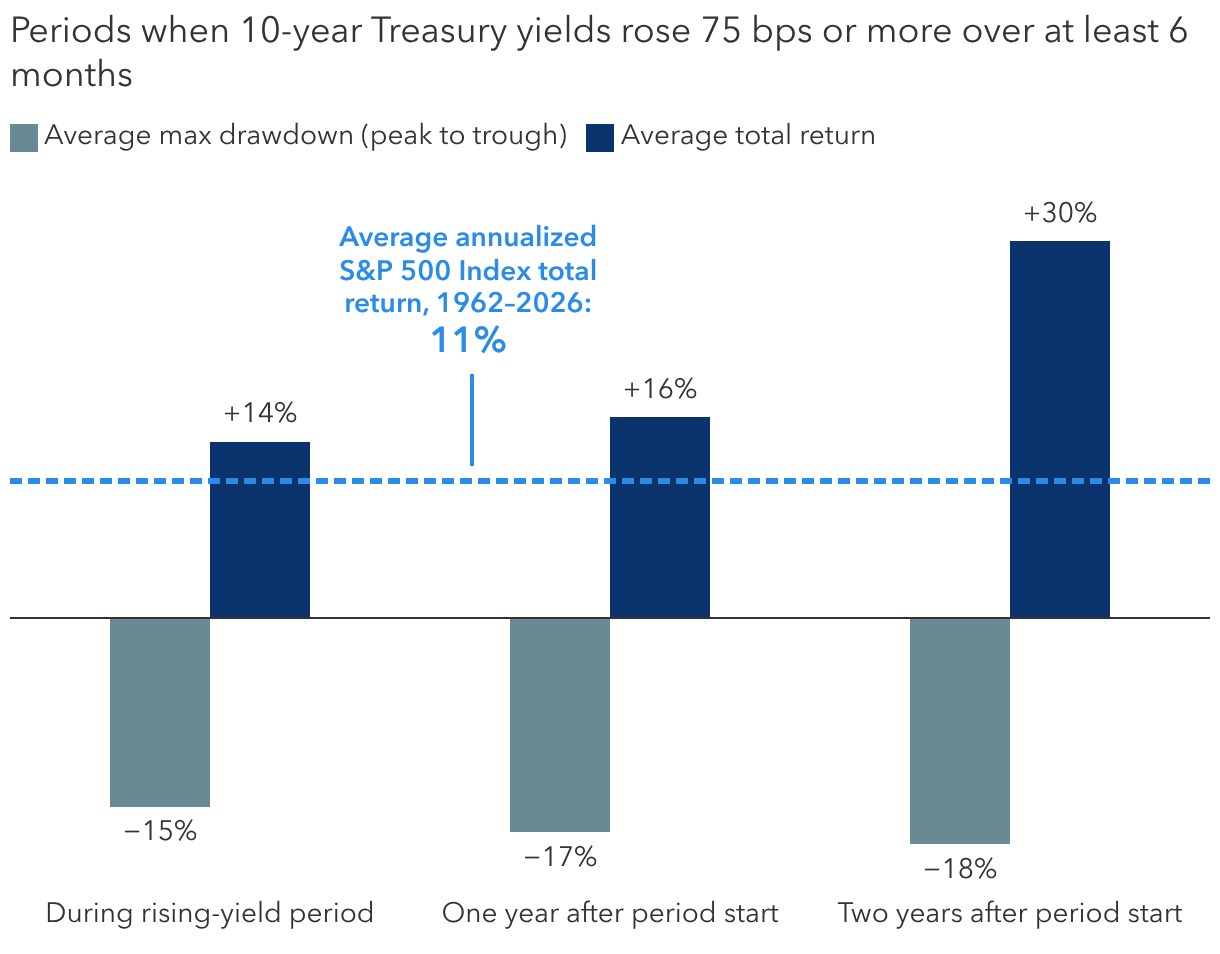
History shows stocks can handle higher rates


“Most rising rate environments correspond with economic growth, so they’re more common than investors may think,” says Cheryl Frank, equity portfolio manager.


“Markets tend to wobble when long-term rates jump 50 to 100 basis points, but generally shake it off, which is where we are today. Stocks typically begin to fall apart only after rates have risen much further — historically when long-term bond yields climbed 2% to 2.5%.”

Stocks gained even as 10-year Treasury yields rose

Sources: Capital Group, Bloomberg, Federal Reserve Bank of St. Louis, S&P Global. Rising-yield periods are defined as increases of at least 75 basis points in the 10-year US Treasury constant maturity yield over six months or longer. Analysis includes 23 periods between January 1962 and August 2026 and excludes the ongoing period that began 28 February 2026. Total return averages are cumulative and assume dividend reinvestment. Maximum drawdown represents the average peak-to-trough decline during each observed period. Past results are not predictive of results in future periods.

Frank does not expect Treasury yields to surge from here, partly because the Trump administration has shown it wants to keep borrowing costs down. “Still, I’m mindful of volatility in the rates market. I’m working to make sure my portfolios are not leaning too heavily into high-growth, high-valuation stocks since they tend to reprice lower as rates rise,” Frank explains. “That means diversifying into industries such as financials, insurance, energy and certain commodities. Many of these companies trade at more reasonable valuations, generate strong cash flows and pay attractive dividends.”


Of course, the AI boom should not be ignored, and a balanced portfolio includes investments in AI and AI-related companies, Frank says. “This could be one of the biggest technological advancements in our lifetime, with profound impacts on every part of the economy. I’m optimistic about AI’s potential to broaden beyond semiconductors and early beneficiaries of the AI build-out.”


Back to the future


Higher rates and a quieter Fed mark a return to the economic environment prior to the global financial crisis, when markets were guided by inflation, growth outlook and fundamentals, Queen says.


“At the start of my career in the early 1990s, many investors thought long-term Treasury yields of 5.75% were unusually low and had little room to fall. Instead, bonds spent the decades that followed moving lower. That taught me that investors tend to anchor on recent events,” Queen adds. “Today, many investors are more familiar with the ultra-low rate environment. But if you take a step back, the current interest rate makes sense in a world where inflation is above 2% and economic growth is healthy.”


He notes there may be periods of volatility, particularly if inflation remains higher than businesses and consumers would prefer. “But ultimately, the reason you own bonds is to offset equities, which offer greater upside but more volatility. Today’s starting yields of around 5% mean that bonds are better positioned to offer income and a measure of stability.”

John Queen is a fixed income portfolio manager with 36 years of investment industry experience (as of 12/31/2025). He holds a bachelor's degree in industrial management from Purdue University. He also holds the Chartered Financial Analyst® designation.

Tom Hollenberg is a fixed income portfolio manager with 21 years of industry experience (as of 12/31/2025). He holds an MBA in finance from MIT and a bachelor's degree from Boston College.

Cheryl Frank is an equity portfolio manager with 28 years of investment industry experience (as of 12/31/2025). She holds an MBA from Stanford and a bachelor’s degree from Harvard.

Past results are not predictive of results in future periods. It is not possible to invest directly in an index, which is unmanaged. The value of investments and income from them can go down as well as up and you may lose some or all of your initial investment. This information is not intended to provide investment, tax or other advice, or to be a solicitation to buy or sell any securities.
 
Statements attributed to an individual represent the opinions of that individual as of the date published and do not necessarily reflect the opinions of Capital Group or its affiliates. All information is as at the date indicated unless otherwise stated. Some information may have been obtained from third parties, and as such the reliability of that information is not guaranteed.
 
Capital Group manages equity assets through three investment groups. These groups make investment and proxy voting decisions independently. Fixed income investment professionals provide fixed income research and investment management across the Capital organisation; however, for securities with equity characteristics, they act solely on behalf of one of the three equity investment groups.