Long-Term Investing
Categories
Markets & Economy
4 charts that explain U.S. labor dynamics
 Darrell Spence
May 17, 2022
The latest consumer price index (CPI) report released Wednesday, May 11, has confirmed that the U.S. Federal Reserve has a long way yet to go in its fight against inflation. Core inflation — all items except food and energy — rose 6.2% year over year in April, keeping it at a level not seen in nearly 40 years.
Much of this is, no doubt, created by supply shocks, which fall outside the central bank’s area of control, as Fed Chair Jerome Powell pointed out in his press conference earlier this month. The Fed can, however, affect demand in the historically tight labor market. Its plan to continue implementing 50 basis point (bps) rate hikes should introduce some slack — but the question is, how far will it have to go to achieve its goal on inflation?
We are starting to see a very moderate wage-price spiral developing in the United States, and as I've looked at the landscape, I don’t see a clear path to bring inflation back to the Fed’s 2% target without putting the economy into a recession.
Here are four charts on labor dynamics that explain why I believe this is the case.
1. Workers expect bigger salaries to make up for higher prices
Workers are asking for higher compensation because the prices of the products that impact their inflation expectations have surged. As the chart below shows, people’s view of inflation is very closely linked to the prices of gasoline and food. U.S. gasoline prices are already sitting at record highs, even before the peak summer driving season kicks off. And a number of factors, such as the war in Ukraine and a looming fertilizer shortage, are pushing food prices higher.
Inflation expectations largely track food and fuel prices
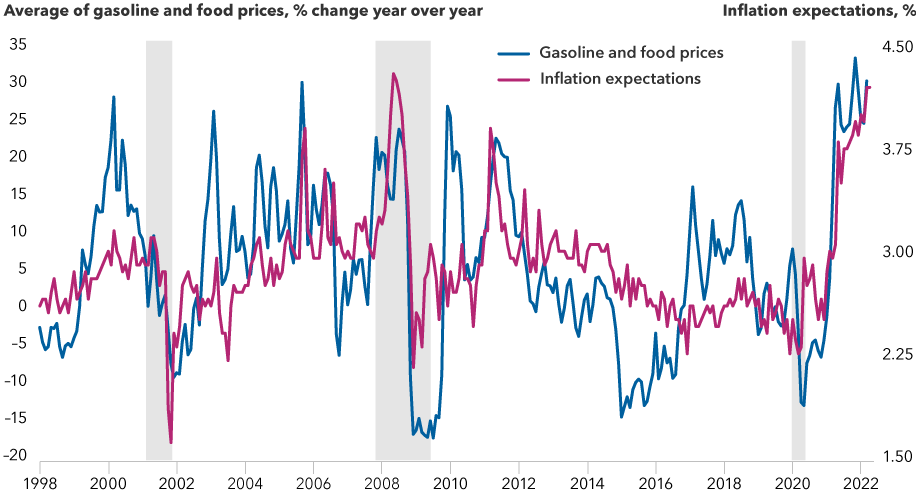
Sources: University of Michigan, Bureau of Labor Statistics. Data as of April 30, 2022. Shaded areas represent recessions.
2. Employers are raising wages given tight market
Workers are getting the higher compensation they are asking for because the labor market is extremely tight. Many workers who went missing during the pandemic have not come back. Today’s unemployment rate is similar to before the pandemic, but the labor force participation rate still lags. It was 62.2% in April 2022, compared to 63.4% in February 2020, according to the Bureau of Labor Statistics (BLS). Employers also reported a record 11.5 million open jobs in March 2022, according to BLS data.
The natural unemployment rate, which represents unemployment not linked to cyclical demand, has declined over time, but is still likely a full percent above the current unemployment rate, and perhaps higher.
Compensation soars as unemployment returns to pre-pandemic lows
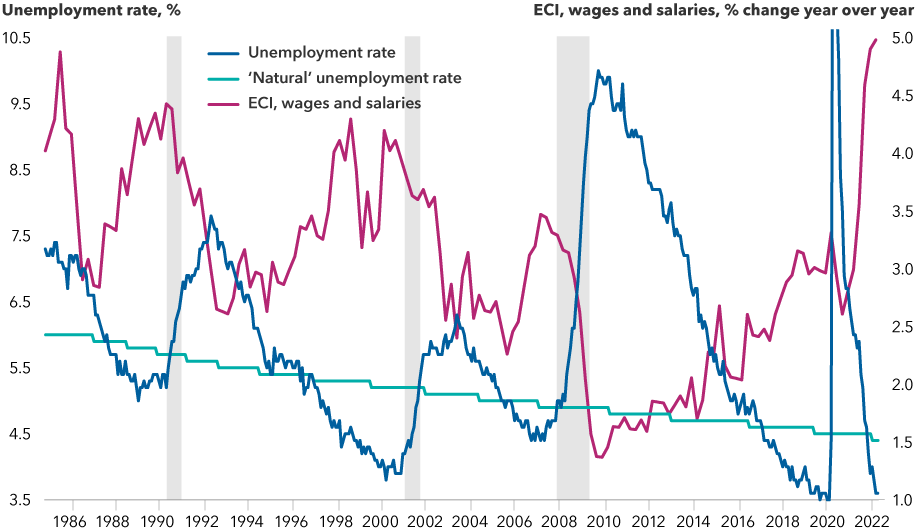
Sources: Bureau of Labor Statistics, Congressional Budget Office. ECI = employment cost index. Data as of April 30, 2022. Shaded areas represent recessions.
3. Productivity growth is not offsetting compensation costs
Productivity has not been keeping up with wage growth, so unit labor costs have been rising sharply. In fact, over the past four quarters, productivity fell 0.6%, resulting in a 7.2% increase in unit labor costs, the largest since an 8.2% increase in 1982.
Less for more: Productivity declines as wages rise
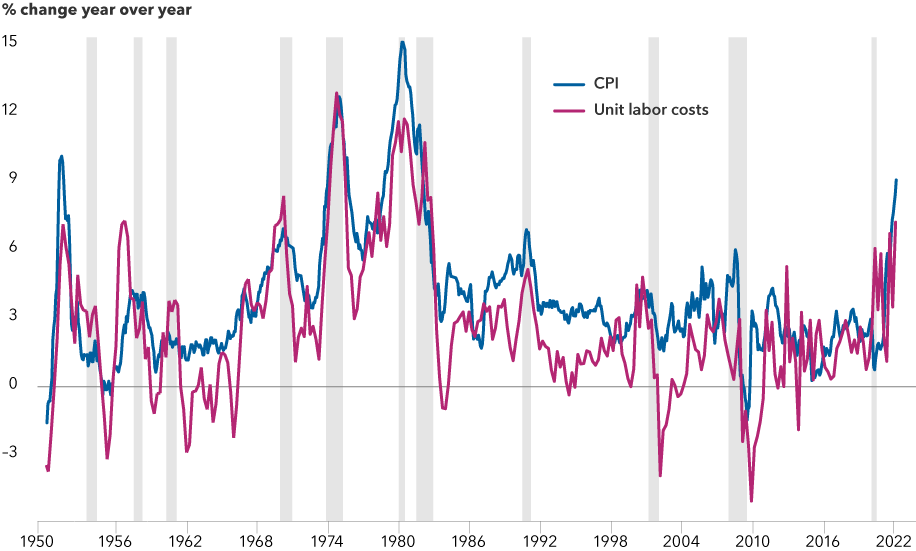
Source: Bureau of Labor Statistics. CPI = consumer price index. Data as of April 30, 2022. Shaded areas represent recessions.
4. Relieving this pressure could require growth to slow well below potential
The unemployment rate may need to rise as much as 2.0% or more before wage growth starts to moderate. Okun’s law, which describes the relationship between employment and production, suggests if that were to occur in one year, it would require gross domestic product (GDP) growth to be 4% lower than potential, or the level where it would be if all of the economy’s resources were fully employed.
Okun’s law indicates growth must slow to bring inflation down
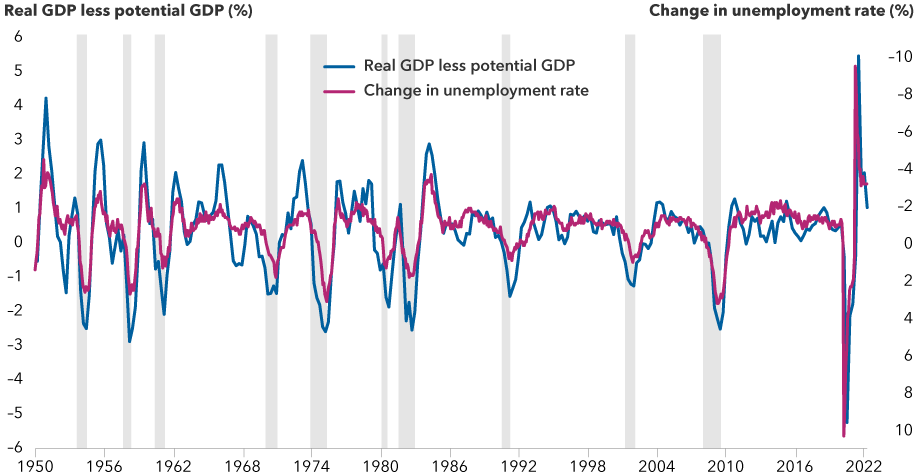
Source: Capital Group calculations, Bureau of Labor Statistics, Congressional Budget Office, Bureau of Economic Analysis. Data as of April 30, 2022. GDP = gross domestic product. Potential GDP is the theoretical level of where a country’s GDP should be if all its resources are fully employed, Y-axis on the right-hand side of the chart is inverted to illustrate the correlation between GDP and unemployment. Shaded areas represent recessions.
The bottom line
Inflation appears to be increasingly entrenched and persistent. Interest rates, both short- and long-term, could go up more than the market expects. The only way to really break the wage-price spiral, in my view, is to create a lot of slack in the labor market, which is done by pushing the unemployment rate up, which in turn could lead us into a recession.
There are, of course, alternative scenarios that could come to pass, including: 1) inflation falls of its own volition, 2) the Fed capitulates and lets inflation run unchecked, or 3) the Fed achieves a “soft landing” (a moderate economic slowdown). However, none of these appear to me to be high-probability outcomes, and a soft landing may not free up much slack anyway.
Given the Fed’s focus on taming inflation, which is being exacerbated by recent developments that include rolling COVID-19 shutdowns of cities in China and prolongation of the Russia-Ukraine conflict, there is now a higher probability that we may be in a recession by the end of 2022 or early 2023.
Learn more about
Institutional investors rely on our newsletter. Have you subscribed?
Our latest insights
-
-
-
Artificial Intelligence
-
World Markets Review
-
Demographics & Culture
RELATED INSIGHTS
-
Chart in Focus
-
-
Artificial Intelligence
Don’t miss out
Get the Capital Ideas newsletter in your inbox every other week
Investments are not FDIC-insured, nor are they deposits of or guaranteed by a bank or any other entity, so they may lose value.
Investors should carefully consider investment objectives, risks, charges and expenses.
This and other important information is contained in the fund prospectuses and summary prospectuses, which can be obtained from a financial professional and should be read carefully before investing.
Statements attributed to an individual represent the opinions of that individual as of the date published and do not necessarily reflect the opinions of Capital Group or its affiliates. This information is intended to highlight issues and should not be considered advice, an endorsement or a recommendation.
All Capital Group trademarks mentioned are owned by The Capital Group Companies, Inc., an affiliated company or fund. All other company and product names mentioned are the property of their respective companies.
Use of this website is intended for U.S. residents only.
Effective July 1, 2024, American Funds Distributors, Inc. was renamed Capital Client Group, Inc.
This content, developed by Capital Group, home of American Funds, should not be used as a primary basis for investment decisions and is not intended to serve as impartial investment or fiduciary advice.