Election
4 things to watch ahead of the U.S. elections
February 8, 2024

Insights, tools and resources from Capital Group to help you support clients during unsteady markets

Get the latest results for all our mandates
Join our investment team as we examine the forces roiling markets
Connect to the minds and insights shaping the world of investments

Investors often flee the market during a decline, and buy back in when stocks are skyrocketing. Both can have negative impacts.
Timely and actionable insights to help you make sense of the markets and guide your investment decisions
Election
Economic Indicators
Global Equities

Although every market decline is unique, the average S&P 500 bear market since 1950 has lasted 14 months. The average bull market has been more than five times longer.
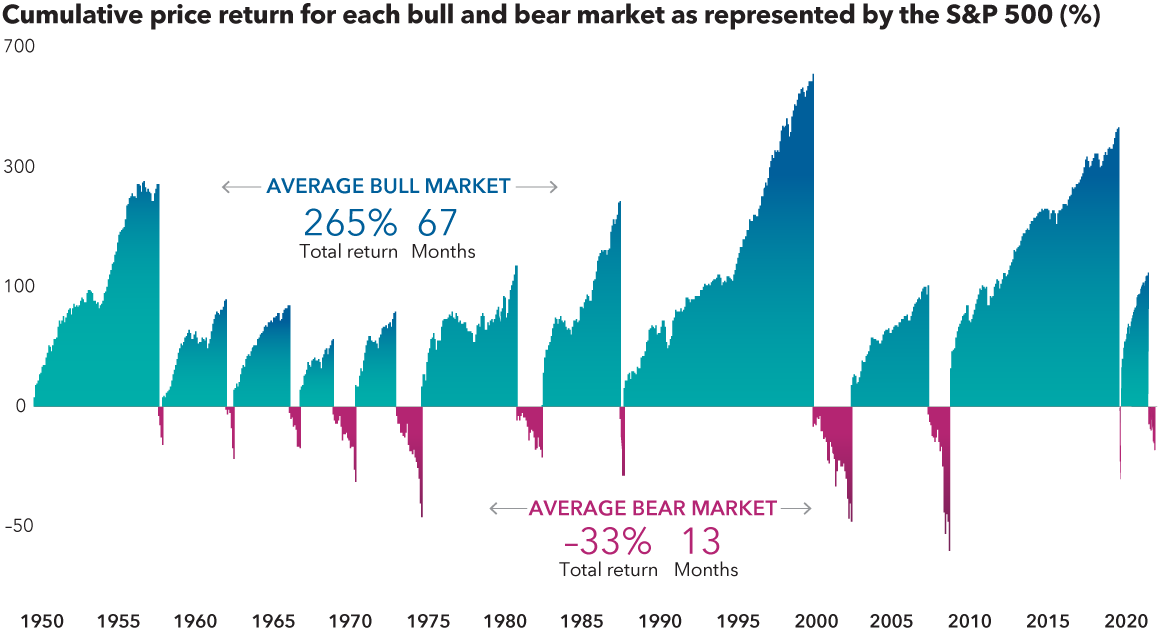
Although every market decline is unique, the average S&P 500 bear market since 1950 has lasted 13 months. The average bull market has been more than five times longer.
Sources: Capital Group, RIMES, Standard & Poor’s. As of 6/15/22. Bear markets are peak-to-trough price declines of 20% or more in the S&P 500. Bull markets are all other periods. Returns shown on a logarithmic scale. Returns in USD.
Support for you and your clients
Our team is ready to assist you.
Commissions, trailing commissions, management fees and expenses all may be associated with mutual fund investments. Please read the prospectus before investing. Mutual funds are not guaranteed, their values change frequently and past performance may not be repeated.
Standard & Poor's 500 Composite Index is a market capitalization-weighted index based on the results of approximately 500 widely held common stocks.
Forward-looking statements are not guarantees of future performance, and actual events and results could differ materially from those expressed or implied in any forward-looking statements made herein. We encourage you to consider these and other factors carefully before making any investment decisions and we urge you to avoid placing undue reliance on forward-looking statements.
The S&P 500 Composite Index (“Index”) is a product of S&P Dow Jones Indices LLC and/or its affiliates and has been licensed for use by Capital Group. Copyright © 2022 S&P Dow Jones Indices LLC, a division of S&P Global, and/or its affiliates. All rights reserved. Redistribution or reproduction in whole or in part are prohibited without written permission of S&P Dow Jones Indices LLC.
Indices are unmanaged and cannot be invested in directly. Returns represent past performance, are not a guarantee of future performance, and are not indicative of any specific investment.
References to particular companies or securities, if any, are included for informational or illustrative purposes only and should not be considered as an endorsement by Capital Group. Views expressed regarding a particular company, security, industry or market sector should not be considered an indication of trading intent of any investment funds or current holdings of any investment funds. These views should not be considered as investment advice nor should they be considered a recommendation to buy or sell.
Statements attributed to an individual represent the opinions of that individual as of the date published and do not necessarily reflect the opinions of Capital Group or its affiliates. This information is intended to highlight issues and not be comprehensive or to provide advice. For informational purposes only; not intended to provide tax, legal or financial advice. We assume no liability for any inaccurate, delayed or incomplete information, nor for any actions taken in reliance thereon. The information contained herein has been supplied without verification by us and may be subject to change. Capital Group funds are available in Canada through registered dealers. For more information, please consult your financial and tax advisors for your individual situation.
All Capital Group trademarks are owned by The Capital Group Companies, Inc. or an affiliated company in Canada, the U.S. and other countries. All other company names mentioned are the property of their respective companies.
Capital Group funds are offered in Canada by Capital International Asset Management (Canada), Inc., part of Capital Group, a global investment management firm originating in Los Angeles, California in 1931. Capital Group manages equity assets through three investment groups. These groups make investment and proxy voting decisions independently. Fixed income investment professionals provide fixed income research and investment management across the Capital organization; however, for securities with equity characteristics, they act solely on behalf of one of the three equity investment groups.