Market Volatility
Categories
Dividends
Dividend investing across portfolios: More than just income
 Winnie Kwan
 Chitra Gopal
 Ben Lin
April 14, 2023
For advisor use only. Not for use with investors.
Measure twice, cut once.
That old proverb may be the best way to describe Capital Group’s approach to dividend investing: we take extra first steps to try to ensure we don’t make a mistake. In the following, seasoned Capital Group investment professionals take you through their advanced research methods when dividend investing and explain why dividend-growing companies can provide more advantages than simply offering income in tough times. Dividend-investing does, they assert, have the potential to add value through long-term real return generation, making it an essential ingredient for diversified portfolios designed to meet various investment outcomes: income, capital appreciation and preservation.
Not all dividends are created equal
Winnie Kwan, equity portfolio manager, Capital Group Capital Income Builder™ (Canada)
In a dividend growth strategy, one should expect to find companies that are growing. Their management should exercise good capital allocation discipline and enable dividend payments to reward shareholders. Companies generating rising streams of free cash flows can guard against inflation.
At Capital Group, our research team goes to great lengths to study the quality of dividends. We group them into three groups based on their unique characteristics.
Dividend compounders. These are companies that typically grow dividends over time and generate risk-adjusted returns above the broader market. Linde, one of the largest industrial gas makers, is an example of a dividend compounder. Its uninterrupted track record of dividend growth and payments is underpinned by healthy cash flows generated through long-term client contracts. The company’s investment in hydrogen creates an added growth element.
Bond proxies. The second group comprises bond proxies, which have higher-than-market yield but lower dividend growth. These are often regulated businesses with predictable cash flow and earnings. An example is U.S. regulated utility company Entergy, which operates in industrial-heavy states and generates predictable free cash flows.
Cyclical winners. The third group is focused on companies towards the end of their cyclical cycle which creates the opportunity to capture the recovery in earnings, dividends and market multiples. An example of a cyclical winner is Raytheon Technologies in the aerospace and defence sector, where revenue and margins have yet to return to pre-COVID levels.
It is also our job to look out for dividend cutters and avoid them as they tend to fair worse than market averages.
The importance of historical track record
History does not lie. We get a good sense of a company’s capital allocation strategy and the key incentives of the management team through its historical track record. We also look at board dynamics (understanding how they interact with each other and make decisions) and study how they work with the management. A healthy board-management relationship is key to good governance and organizational effectiveness.
These are some of the factors we analyze using the dividend-ratings process developed by our Quantitative Research & Analytics group which is illustrated in the following exhibit. The quantitative screening, a starting point for additional analysis, works like a credit-rating system where companies that pass seven criteria are rated AAA. It screens out companies with unsustainable dividends, weak balance sheets, low quality earnings and poor cash flow visibility. The complete assessment involves the pairing of quantitative screening with qualitative analysis. There is a need to differentiate between a company’s ‘ability’ to pay a dividend (based on variables such as business fundamentals and outlook) and a company’s ‘willingness’ to sustain and/or grow its dividend. The latter is where qualitative analysis can add value and our research and role as an active manager come into play.
Capital Group’s dividend ratings process for analyzing companies
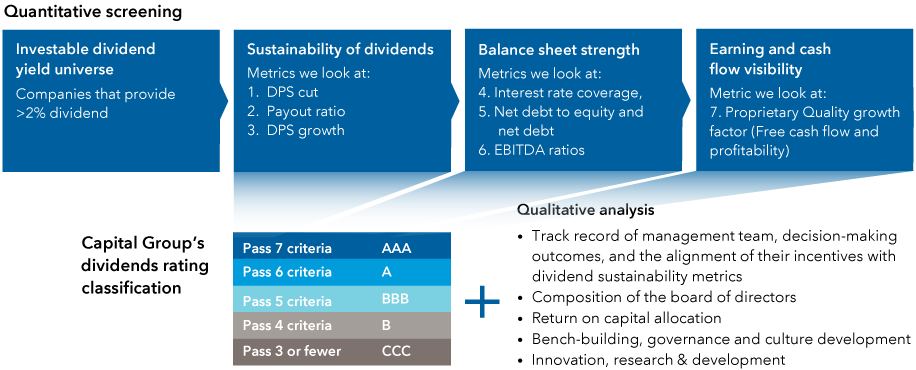
DPS: dividend per share. EBITDA: earnings before interest, taxes, depreciation and amortization.
Analyzing dividends
Chitra Gopal, equity investment analyst
Dividend payments can impact companies in two ways. First, they cultivate financial management discipline to maintain a dividend commitment. This could, for instance, drive project selectivity, and thus reduce resource wastage and improve the return on invested capital (ROIC) over time. Second, the ability to grow dividends can demonstrate profitability as well as confidence in the sustainability of a business.
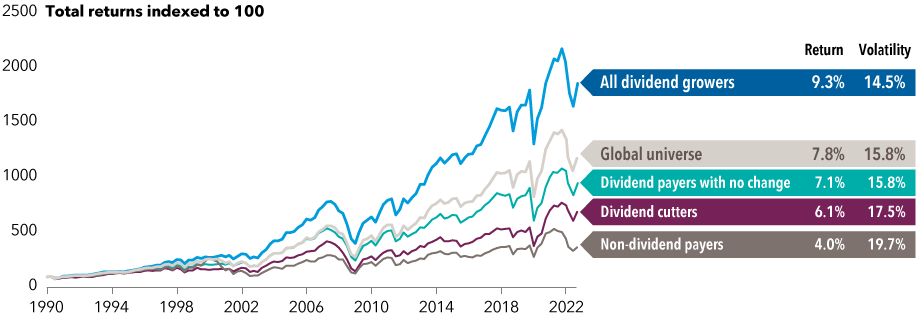
I use two buckets when categorizing dividends. Bucket one consists of industry leaders with products or services so valuable there is little risk of substitution. These companies sustain margins due to some competitive edge, which can be in the form of information technology, scale, or assets with long useful lives. This bucket contains the most fertile hunting grounds for dividend growers and companies that are committed to protect and grow dividends over time as illustrated in the following chart. It shows dividend growers typically have strong returns with low volatility compared to the global universe, while non-dividend payers have a poor risk-reward profile. One company that fits this bucket is U.S.-based KLA, which serves the semiconductor industry with highly complex inspection tools coupled with multi-year service contracts. Maintaining a long-term commitment from clients allows KLA to generate a steady stream of free cash flow, while its advanced tools provide the company with a competitive advantage given the lack of substitutes.
Dividend growers have delivered superior results over time
Past results are not a guarantee of future results.
Data from December 1989 to December 2022. Returns are based on the weighted average of total returns in USD (with gross dividend reinvested) of a global universe of companies. The universe consists of the 1000 largest companies in the S&P BMI Global Indices for North America (50% weight) , Europe (25%), Japan (10%) and the 500 largest companies for Emerging Markets (10%) and Pacific x Japan (5%) from December 1989 to December 2004 and the 1000 largest companies in the MSCI IMI Indices for North America, Europe and Japan and the 500 largest companies for Emerging Markets and Pacific x Japan thereafter. The universe constituents are rebalanced quarterly. Volatility reflects annualized standard deviation of monthly total returns. Sources: QRA, Factset, Compustat, Worldscope, MSCI.
Bucket two comprises low capex-intensive businesses with very high conversion of net income to free cash flow. While free cash flows and dividends can surge when margins are expanding, the reverse can also be true, hence it warrants extra care when investing in such companies. In some countries, companies tend to have a high-dividend pay-out ratio, but this is motivated by the desire to reduce tax payments, which isn’t really a sign of financial discipline.
Engaging management teams
Engaging companies on dividends is a dialogue. My objective is to help them address their commitments and arrive at the best decisions. A common issue is company managements sometimes view share repurchases and dividend payments as equivalent. In reality, paying dividends is a direct return of cash to shareholders, while repurchasing shares is a capital allocation decision made by management, similar to mergers and acquisitions or capital expenditure.
Key trends shaping today’s world
Some managements lean toward share repurchases over dividends, as repurchases reduce share count, and boost earnings per share — and often they may be compensated based on earnings per share growth. But having that as the preferred option to rewards shareholders means they may have not fully understood the differences between dividends and a share buyback. Engaging the management on this topic can take years, and the resources we use to facilitate dividend discussions include a 30-page presentation, which has tested analysis and fully automated company specific analytics.
When market cycles shift, market leadership changes, along with many trends that are taking shape around the world. The key ones I’m observing include the development of artificial intelligence and energy-efficient computing. These span a wide gamut of use cases from drug discovery, identifying social media disinformation, fraud detection to predictive maintenance. Another major trend is the shift towards decarbonization. It goes beyond putting more electric vehicles on the road. Rather, there is a need to fundamentally change our infrastructure such as equipping factories to be power efficient and retooling energy grids to accommodate more renewables.
Understanding of business cyclicality
Ben Lin, investment analyst
The market environment has moved away from being overly growth focused. Instead, we are entering one where companies with steady dividends will become more prevalent and the projection of principal value can be done with greater accuracy.
Over the years, I have grown to understand the cyclical nature of companies’ earnings and dividends in the industrials space. I tend to look for industrials companies with a strong starting yield and a healthy balance sheet, and have the ability to generate free cash flow. These are key features to maintaining earnings.
Another area of potential opportunities is in the insurance space. The earnings of insurance companies can be volatile due to high levels of investment income and the need to comply with mark-to-market accounting requirements. What insurers like AIA Group have done is pegging dividend payouts as a percentage of normalised earnings. This provides stability in dividends and is more aligned with the long-term nature of insurance businesses.
Fundamental research matters
Fundamental research is crucial for developing a deep understanding of a company and the broader industry. We tend to follow the progress of companies for many years, and in the process uncover some of the most interesting developments. One example is Midea Group, which manufactures electrical appliances such as refrigerators and air conditioners. Our analyst team began researching the company and its products in the early 2000s. Since then, the Chinese firm has undergone the process of disintermediation to sell products directly to consumers. Midea’s automation technology also allows it to transform its business model to made-to-order production and become less working-capital intensive. This resulted in significant free cash flow generation, allowing Midea to redistribute cash for growth and pay shareholders in the form of dividends and share buybacks.
Meanwhile, Japanese companies are sitting on large cash piles that can account for a significant percentage of their market capitalization. On a positive note, their dividend payout ratios have been on the rise. We hope to see further improvements through our ongoing discussions with Japanese industrials companies about returning cash to shareholders and improving their capital efficiency.
Management is key
We build long-term relationships with generations of management teams and strive for regular and strong engagements to assess their abilities as part of our qualitative analysis. Some of the positive management changes I have witnessed involved new leadership at the top. These are critical and can open new possibilities.
In reality, changing a management team’s view is hard as they have their set ways of thinking. But over the years, we have found successes in some companies and seen the development of steady and progressive dividend policies. All of these take time and devotion. But it will be well worth it, because the eventual success of a company very much depends on its management.
Investment implications
All in all, dividend growers — stocks that pay and consistently grow a dividend — are key to long-term return generation. Capital Group’s analysis shows they have typically been higher quality firms with solid fundamentals. We believe dividend-focused strategies could provide a more resilient outcome across portfolios, including multi-asset and standalone equity funds.
Learn more about
This content is confidential and designed for the exclusive use of registered dealers and their representatives. Canadian securities legislation, including National Instrument 81-102, prohibits its distribution to investors, potential investors or the general public. It is not intended to be a sales communication, as defined in the Instrument, and has not been designed to comply with its requirements relating to sales communications.
Our latest insights
-
-
Market Volatility
-
-
Currencies
-
Market Volatility
RELATED INSIGHTS
Commissions, trailing commissions, management fees and expenses all may be associated with investments in investment funds. Please read the prospectus before investing. Investment funds are not guaranteed or covered by the Canada Deposit Insurance Corporation or by any other government deposit insurer. For investment funds other than money market funds, their values change frequently. For money market funds, there can be no assurances that the fund will be able to maintain its net asset value per security at a constant amount or that the full amount of your investment in the fund will be returned to you. Past performance may not be repeated.
Unless otherwise indicated, the investment professionals featured do not manage Capital Group‘s Canadian investment funds.
References to particular companies or securities, if any, are included for informational or illustrative purposes only and should not be considered as an endorsement by Capital Group. Views expressed regarding a particular company, security, industry or market sector should not be considered an indication of trading intent of any investment funds or current holdings of any investment funds. These views should not be considered as investment advice nor should they be considered a recommendation to buy or sell.
Statements attributed to an individual represent the opinions of that individual as of the date published and do not necessarily reflect the opinions of Capital Group or its affiliates. This information is intended to highlight issues and not be comprehensive or to provide advice. For informational purposes only; not intended to provide tax, legal or financial advice. Capital Group funds are available in Canada through registered dealers. For more information, please consult your financial and tax advisors for your individual situation.
Forward-looking statements are not guarantees of future performance, and actual events and results could differ materially from those expressed or implied in any forward-looking statements made herein. We encourage you to consider these and other factors carefully before making any investment decisions and we urge you to avoid placing undue reliance on forward-looking statements.
The S&P 500 Composite Index (“Index”) is a product of S&P Dow Jones Indices LLC and/or its affiliates and has been licensed for use by Capital Group. Copyright © 2026 S&P Dow Jones Indices LLC, a division of S&P Global, and/or its affiliates. All rights reserved. Redistribution or reproduction in whole or in part are prohibited without written permission of S&P Dow Jones Indices LLC.
FTSE source: London Stock Exchange Group plc and its group undertakings (collectively, the "LSE Group"). © LSE Group 2026. FTSE Russell is a trading name of certain of the LSE Group companies. "FTSE®" is a trade mark of the relevant LSE Group companies and is used by any other LSE Group company under licence. All rights in the FTSE Russell indices or data vest in the relevant LSE Group company which owns the index or the data. Neither LSE Group nor its licensors accept any liability for any errors or omissions in the indices or data and no party may rely on any indices or data contained in this communication. No further distribution of data from the LSE Group is permitted without the relevant LSE Group company's express written consent. The LSE Group does not promote, sponsor or endorse the content of this communication. The index is unmanaged and cannot be invested in directly.
BLOOMBERG® is a trademark and service mark of Bloomberg Finance L.P. and its affiliates (collectively “Bloomberg”). Bloomberg or Bloomberg’s licensors own all proprietary rights in the Bloomberg Indices. Neither Bloomberg nor Bloomberg’s licensors approves or endorses this material, or guarantees the accuracy or completeness of any information herein, or makes any warranty, express or implied, as to the results to be obtained therefrom and, to the maximum extent allowed by law, neither shall have any liability or responsibility for injury or damages arising in connection therewith.
The MSCI information may only be used for your internal use, may not be reproduced or redisseminated in any form and may not be used as a basis for or a component of any financial instruments or products or indices. None of the MSCI information is intended to constitute investment advice or a recommendation to make (or refrain from making) any kind of investment decision and may not be relied on as such. Historical data and analysis should not be taken as an indication or guarantee of any future performance analysis, forecast or prediction. The MSCI information is provided on an “as is” basis and the user of this information assumes the entire risk of any use made of this information. MSCI, each of its affiliates and each other person involved in or related to compiling, computing or creating any MSCI information (collectively, the “MSCI Parties”) expressly disclaims all warranties (including, without limitation, any warranties of originality, accuracy, completeness, timeliness, non-infringement, merchantability and fitness for a particular purpose) with respect to this information. Without limiting any of the foregoing, in no event shall any MSCI Party have any liability for any direct, indirect, special, incidental, punitive, consequential (including, without limitation, lost profits) or any other damages. (www.msci.com)
Capital believes the software and information from FactSet to be reliable. However, Capital cannot be responsible for inaccuracies, incomplete information or updating of the information furnished by FactSet. The information provided in this report is meant to give you an approximate account of the fund/manager's characteristics for the specified date. This information is not indicative of future Capital investment decisions and is not used as part of our investment decision-making process.
Indices are unmanaged and cannot be invested in directly. Returns represent past performance, are not a guarantee of future performance, and are not indicative of any specific investment.
All Capital Group trademarks are owned by The Capital Group Companies, Inc. or an affiliated company in Canada, the U.S. and other countries. All other company names mentioned are the property of their respective companies.
Capital Group funds are offered in Canada by Capital International Asset Management (Canada), Inc., part of Capital Group, a global investment management firm originating in Los Angeles, California in 1931. Capital Group manages equity assets through three investment groups. These groups make investment and proxy voting decisions independently. Fixed income investment professionals provide fixed income research and investment management across the Capital organization; however, for securities with equity characteristics, they act solely on behalf of one of the three equity investment groups.
The Capital Group funds offered on this website are available only to Canadian residents.