Economic Indicators
Categories
Bonds
Diversification isn't dead: Bonds poised to offer balance
 David Hoag
 Timothy Ng
January 30, 2023
Strong yields and the prospect of a less hawkish Federal Reserve are breathing new life into bond portfolios. Although declining inflation is a reason for optimism after a difficult year, investors can’t be certain just yet if the prolonged market volatility is over.
That’s because even if the Fed’s hiking cycle is almost done, the cumulative effect of the aggressive tightening campaign on consumers and businesses remains unclear. Markets expect growth to slow and have penciled in a mild recession in the United States.
However, that picture could change as unemployment and consumer spending data come in. “We could still be in for a bumpy road, though I don’t see the same level of interest rate volatility for bonds,” says David Hoag, portfolio manager for The Bond Fund of America® and American Funds® Strategic Bond Fund.
Diversification and the 60/40 portfolio
Investors who fled volatile stock markets in 2022 faced a new problem: Bonds weren’t offering the stability they had expected. The year-long stretch of both stocks and bonds posting losses left many investors questioning the relevance of the 60% equities/40% bonds portfolio and whether bonds could still provide diversification from equity market downturns.
The profound pessimism in markets globally was tied to central banks raising rates to rein in decades-high inflation. The pain was acute with both the S&P 500 Index and the Bloomberg U.S. Aggregate Bond Index down double digits. The losses were also unique, with 2022 being the only time in 45 years that stocks and bonds declined in tandem.
“Last year was very disappointing since bonds didn’t do what people expected, but at the same time, it was what the Fed needed to happen to bring inflation down,” Hoag explains. “The culprit for the chaos in both stocks and bonds last year was the Fed’s aggressive rate hikes. I think it’s reasonable to say that bonds will go back to offering diversification benefits as we near the end of the tightening cycle.”
Most investors had never faced a year as challenging as 2022
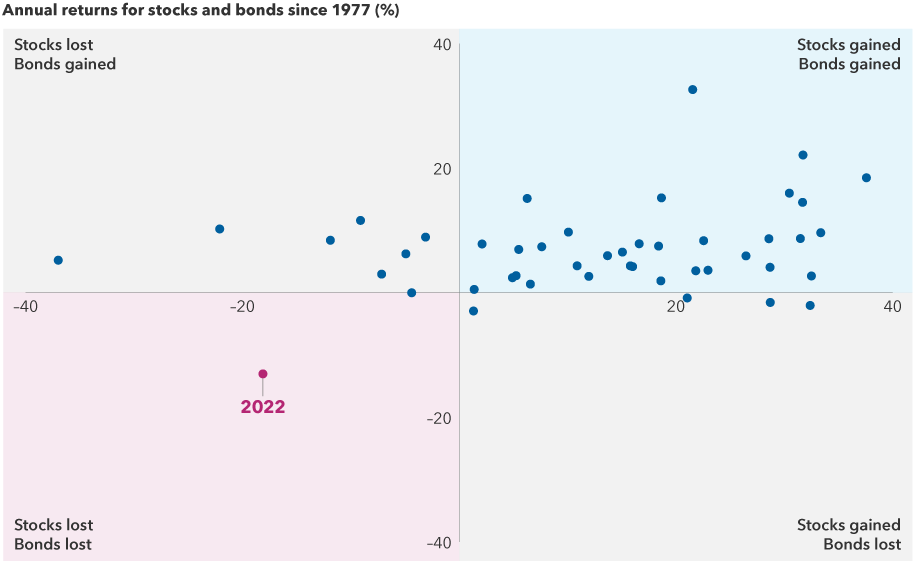
Sources: Capital Group, Bloomberg Index Services Ltd., Standard & Poor's. Each dot represents an annual stock and bond market return from 1977 through 2022. Stock returns represented by the S&P 500 Index. Bond returns represented by the Bloomberg U.S. Aggregate Index. Past results are not predictive of results in future periods.
Bond funds are also offering more income and higher return potential. The yield on the Bloomberg U.S. Aggregate Bond Index, a widely used benchmark for investment-grade (BBB/Baa and above) bond markets, ended 2022 at 4.68% compared to a yield of 1.75% on December 31, 2021. The total return of a bond fund consists of distributions, price changes and interest paid, and the latter has been rising.
With high returns potential from core bond funds, investors may not need to take as many risks in their equity or bond portfolios, Hoag says. “The magic today is that core bond funds offer more cushion from the income component compared to the start of last year.”
This also means that even amid modest price or interest rate volatility it may be easier to achieve a positive total return in 2023.
Despite the very low yields that investors have faced since the 2007–2008 global financial crisis, healthier income from bonds like we see today is closer to the historical norm. In the past three decades — which includes periods of price or interest rate volatility — core bond total returns were driven predominantly from the interest or coupon component, not price changes.
Historically, income has dominated long-term total return
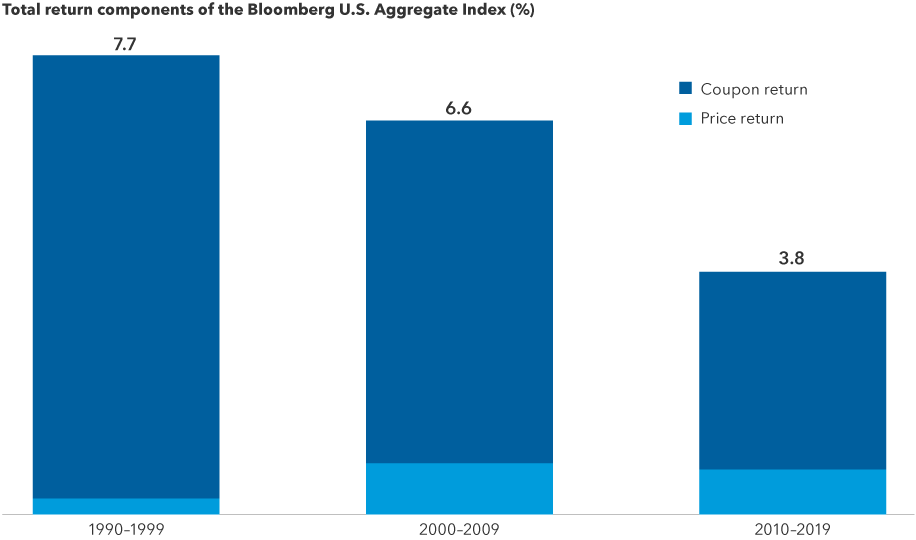
Source: Bloomberg Index Services Ltd. As of 12/30/2022. Past results are not predictive of results in future periods.
Inflation has declined but the Fed can’t declare victory
Whether Fed officials feel confident that they have vanquished inflation is important. The last few months have offered some relief as inflation rates declined from their peak, which has allowed central banks to slow their rate hikes. The Consumer Price Index (CPI), a measure of the average change over time in the prices paid by urban consumers for a market basket of consumer goods and services, rose 6.5% in the year through December, down from 7.1% for the 12 months through November. The Fed’s preferred core inflation measure, which strips out food and energy prices, slowed annually to 5.7% in December from 6.0% a year earlier.
“I see core CPI continuing to decline this year to a range of 3.5% to 4.0%, which is still above the Fed’s 2.0% target level,” says Timothy Ng, fixed income portfolio manager for American Funds Inflation Linked Bond Fund®.
Pandemic-related supply chain disruptions were a big contributor to high inflation in 2022, and that problem has largely dissipated. The demand for workers also fed into higher prices since companies passed on to consumers the increased costs of hiring. There are signs that the worker shortage is beginning to improve, and more companies have paused hirings or announced layoffs.
“Still, the Fed can’t declare victory yet, and the fine-tuning that’s going to happen may be a source of volatility in the market overall,” Ng notes.
Inflation is easing, allowing Fed to slow rate hikes
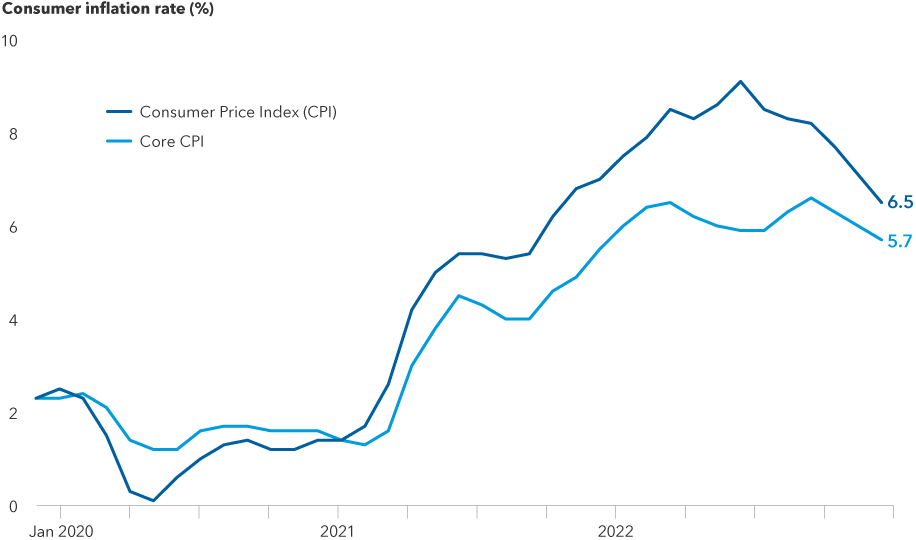
Source: Bloomberg. Data shown from 1/31/2020 to 12/31/2022. The Consumer Price Index (CPI) is a measure of the average change over time in the prices paid by urban consumers for a market basket of consumer goods and services. Core CPI excludes food and energy.
Signs of an economic slowdown … or a recession?
What’s next for policymakers is a thorny question. Rapid rate hikes are necessary to cool inflation, but too much tightening could severely hurt the economy and job figures.
Investors don’t expect a repeat of the same interest rate volatility that hit bond markets in 2022. Inflation is moving in the right direction, and the Fed has already dialed down the pace of hikes, giving officials time to see their policy impact on the broader economy.
Assuming growth continues to deteriorate, the market expects the Fed to pivot from rate hikes to rate cuts in late 2023. Such a dramatic move would positively impact bond prices, as yields would begin to fall. That’s a major reason why high-quality bonds tend to provide diversification from equities: The Fed swoops in to ease policy as stocks get hammered by a sagging economy.
Rate expectations have dramatically changed from 2022
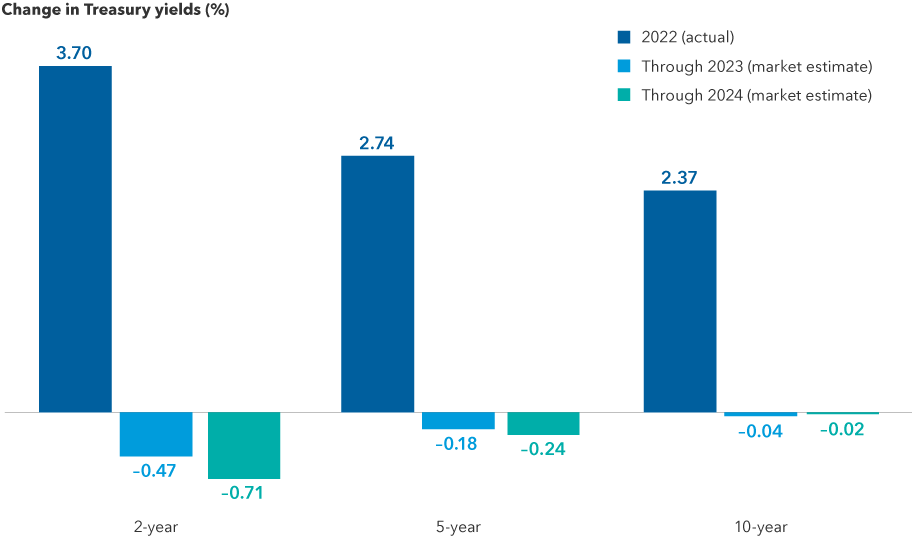
Source: Bloomberg. As of 12/31/2022. Forward estimates based on futures market pricing.
“Investors have been buying Treasuries in part because they expect a mild recession,” Hoag says. The market is also expecting rates to decline by year-end since the Fed may want to get to a rate that is considered “neutral,” or a place where policy is neither stimulating nor restricting economic growth, as the economy weakens further.
Signs of a slowing economy have started to appear beyond a decreased demand for housing. Consumers have begun to pull back on buying cars, furniture and even fuel with retail sales down 1.1% in December compared to the prior month, according to the U.S. Department of Commerce. The Producer Price Index, which reflects inflation at the supplier level, also slowed in December to 6.2% from 7.3% the previous month.
“Once there are some weaknesses, they tend to snowball — and above a certain threshold, it usually means the economy is in a recession,” says Ng.
Under this scenario, actively managed core bond funds that hold high-quality bonds will likely do better than those that hold lower rated debt.
“I’m finding more value in high-quality mortgages rather than investment-grade corporate bonds since I am concerned that the Fed may have already gone too far and tightened by too much,” Hoag says.
The search for stability amid volatility
After a series of jumbo rate hikes, the Fed has entered a new phase of smaller increases that give officials time to consider the impact of higher borrowing costs.
“With inflation finally coming down, the likelihood that bond markets experience another year of massive hikes in 2023 is very low,” Ng adds. This is a welcome scenario for bond investors, as it means core bond funds could again offer diversification benefits.
“Economic indicators are dropping from the heavy lifting the Fed did last year, and there’s bound to be stock market volatility. If we enter a recession, policymakers could look to rate cuts, which could help boost returns for core bond funds,” Hoag notes.
Learn more about
Bloomberg U.S. Aggregate Index represents the U.S. investment-grade fixed-rate bond market.
The S&P 500 Index is a market capitalization-weighted index based on the results of approximately 500 widely held common stocks.
Investments are not FDIC-insured, nor are they deposits of or guaranteed by a bank or any other entity, so they may lose value.
Investors should carefully consider investment objectives, risks, charges and expenses.
This and other important information is contained in the mutual fund prospectuses and summary prospectuses, which can be obtained from a financial professional and should be read carefully before investing.
Bond ratings, which typically range from AAA/Aaa (highest) to D (lowest), are assigned by credit rating agencies such as Standard & Poor's, Moody's and/or Fitch, as an indication of an issuer's creditworthiness.
There have been periods when the results lagged the index(es) and/or average(s).
The indexes are unmanaged and, therefore, have no expenses. Investors cannot invest directly in an index.
This report, and any product, index or fund referred to herein, is not sponsored, endorsed or promoted in any way by J.P. Morgan or any of its affiliates who provide no warranties whatsoever, express or implied, and shall have no liability to any prospective investor, in connection with this report. J.P. Morgan disclaimer: https://www.jpmm.com/research/disclosures.
Source: Bloomberg Index Services Limited. BLOOMBERG® is a trademark and service mark of Bloomberg Finance L.P. and its affiliates (collectively "Bloomberg"). Bloomberg or Bloomberg's licensors own all proprietary rights in the Bloomberg Indices. Neither Bloomberg nor Bloomberg's licensors approves or endorses this material, or guarantees the accuracy or completeness of any information herein, or makes any warranty, express or implied, as to the results to be obtained therefrom and, to the maximum extent allowed by law, neither shall have any liability or responsibility for injury or damages arising in connection therewith.
Each S&P Index ("Index") shown is a product of S&P Dow Jones Indices LLC and/or its affiliates and has been licensed for use by Capital Group. Copyright © 2026 S&P Dow Jones Indices LLC, a division of S&P Global, and/or its affiliates. All rights reserved. Redistribution or reproduction in whole or in part is prohibited without written permission of S&P Dow Jones Indices LLC.
Statements attributed to an individual represent the opinions of that individual as of the date published and do not necessarily reflect the opinions of Capital Group or its affiliates. This information is intended to highlight issues and should not be considered advice, an endorsement or a recommendation.
All Capital Group trademarks mentioned are owned by The Capital Group Companies, Inc., an affiliated company or fund. All other company and product names mentioned are the property of their respective companies.
Use of this website is intended for U.S. residents only.
Capital Client Group, Inc.
This content, developed by Capital Group, home of American Funds, should not be used as a primary basis for investment decisions and is not intended to serve as impartial investment or fiduciary advice.