Important information

This website is for Individual Investors in Sweden only.


If you are an Institutional Investor click here, if you are an Financial Intermediary click here. Should you be looking for information for another location, please click here.


By clicking, you acknowledge that you have fully understood and accepted the Legal and Regulatory Information.

Equity How AI is reshaping US equity markets

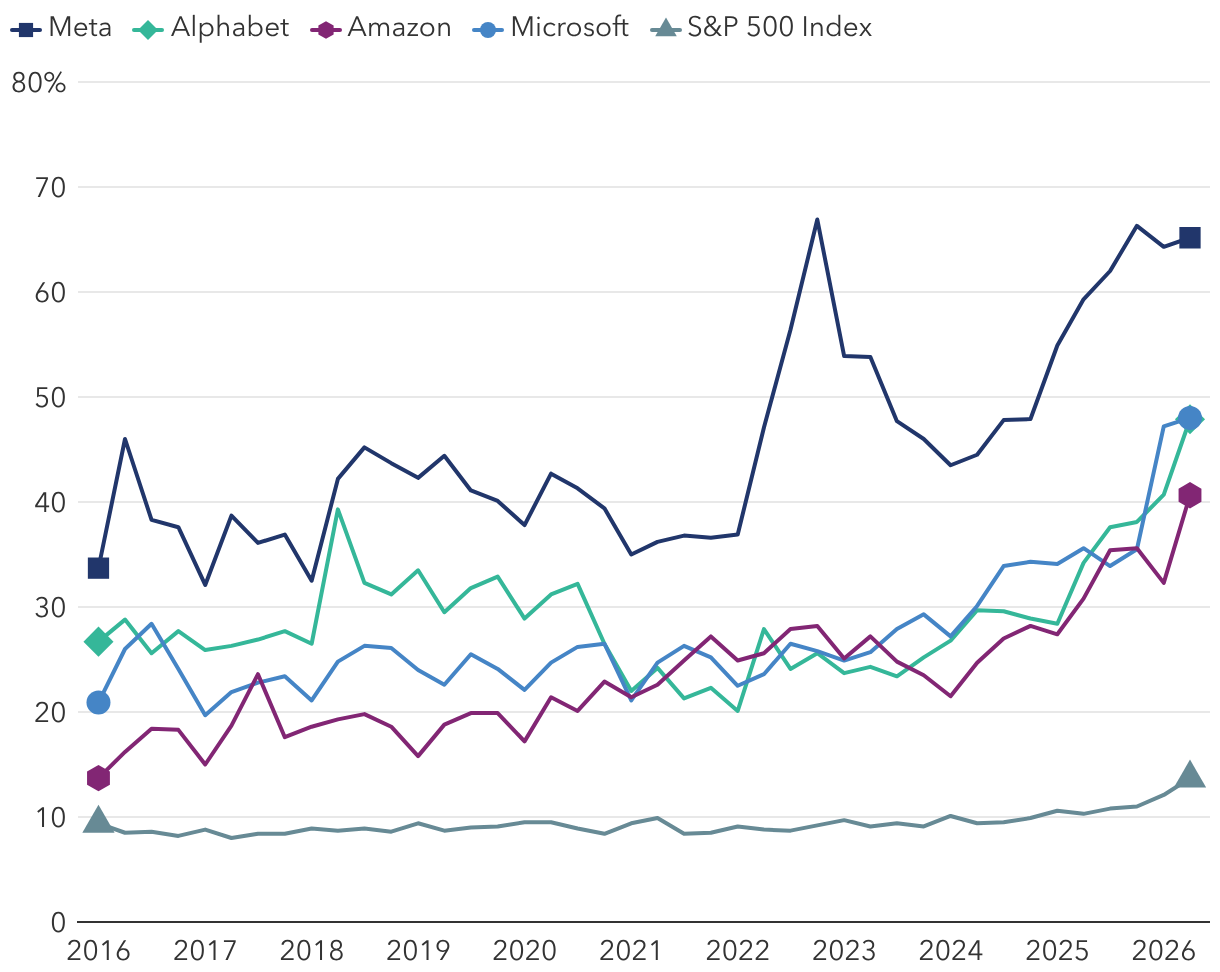
Signs of transformation are emerging in US equity markets amid a torrent of AI-related spending. The shift comes after more than a decade of concentrated gains for market-cap-weighted indices, which, thanks to a narrow group of mega-cap technology stocks, pushed valuations to historic extremes.


Investors are increasingly moving into sectors and individual stocks underrepresented in these indices. Dispersion among the stocks that constitute the S&P 500 Index is near multi-decade highs. Previously lagging sectors such as industrials and style factors including value and yield are reasserting leadership amid expectations that  AI hyperscalers could drive top-line growth.


In this environment, deep fundamental research and careful security selection have become increasingly important. Here are the key themes our team is following.


AI revolution gets physical as earnings surge


Although investors have focused on semiconductor manufacturers and hyperscalers to capitalise on the AI boom, focus has since shifted to AI-adjacent beneficiaries. These companies stand to benefit from a surge of tech-driven capital expenditure amid an arms race to train AI models, deploy them at scale and integrate them into virtual and physical workspaces.


Free cash flow in the tech sector has empowered a substantial increase in earnings expectations over the past few months. But the market appears to see through this dynamic, realising that instead of driving dividends, share buybacks, or mergers and acquisitions as in the past, earnings could turn into top-line growth for AI-adjacent sectors. As a result, forward price-to-earnings valuations of non-tech sectors are picking up.


Outside of the energy rally driven by the Iran war, industrials, utilities and materials have been among  the stronger sectors year-to-date to end March. These sectors drive the picks-and-shovels enablement of the AI boom powering steel- and concrete-intensive data centers built with plumbing, heating, ventilation, and air conditioning (HVAC) machinery and electrical — some of which are back-ordered for years.

AI spending surge puts hyperscalers atop broader market

R&D and capex share of sales

Sources: Capital Group, FactSet. As of 31 March 2026. R&D = research and development costs. Capex = capital expenditure.

Magnificent Seven introduces concentration risk


The Magnificent Seven stocks have been moving in ways that challenge portfolio diversification. There are two dimensions to this:


  • How correlated are these seven stocks to each other?
  • How correlated are they to the rest of the S&P 500?


When correlations are high, the benefits of diversification fall, because these stocks increasingly trade as a single unit. A 2025 analysis by S&P Global Market Intelligence found the average rolling two-year correlation among this cohort hit nearly 60% in 2024, with the highest correlations between Microsoft and both Alphabet and Amazon.


Relative to the S&P 500 Equal Weight Index, the Magnificent Seven’s correlation hit almost 100% in the second half of 2025 before reversing into negative territory, as these stocks have significantly lagged the average S&P 500 stock as of 31 March 2026.


This correlation trend shows that owning all seven is no longer providing independent streams of return but rather one giant concentrated tech position.


Gap widens between winners and losers


Cross-sectional volatility within the S&P 500 is returning to COVID-era highs. This indicates the gap between winners and losers is widening.


A 2025 analysis by Goldman Sachs found that roughly 73% of the variance in the typical S&P 500 stock’s trailing six-month return was driven by company-specific factors, versus an average of 58% from 2002 through the first two months of 2025. Separately, a 2024 analysis by Morningstar found a correlation between higher return dispersion and higher active manager success rates against their benchmarks during the period studied from 1999 to 2023.

S&P 500 cross-sectional volatility rises

Two stacked charts compare annual total return dispersion against cross-sectional return volatility from 2010 to 2025. The upper panel is a bar chart showing the S&P 500 Index constituent annual total return dispersion. Dispersion widens notably around 2020 and again in 2025. The lower panel is a line chart showing cross-sectional return volatility, which fluctuates in the low-to-mid 20% range through most of the 2010s, spikes to 47% in 2020, and rises again to roughly 44% by 2025. Overall, dispersion is greatest when cross-sectional return volatility is highest.

Past results are not predictive of results in future periods.

Source: Source: Capital Group. As of 31 December 2025. Based on Bloomberg total return data for S&P 500 constituents.

Smaller, cheaper and rising fast


Finally, 2026 started with 62.4% of S&P 500 constituents outperforming the index itself — the highest level in more than two decades and a marked reversal from the lows seen in recent years.

Share of individual stocks outperforming hits multidecade high

Percentage of S&P 500 stocks outperforming the index over a calendar year

Past results are not predictive of results in future periods.

Source: Ned Davis Research, Inc. Based on year-end data from 1973 to 2026 (year-to-date as of 16 February 2026).

Returns are no longer concentrated in a handful of mega-cap, growth-oriented stocks. For example, value has outpaced growth. The Russell 1000 Value Index beat the Russell 1000 Growth Index by 12% through the first quarter.


Small-cap stocks represent another area of opportunity. After years of underperformance, they trade at historical valuation discounts relative to large caps. The Russell 2000 Index, which tracks small-cap stocks, outpaced the S&P 500 by more than 5% as of 31 March 2026.


Bottom line


The capital expenditure fueling the AI boom is also driving broader dispersion in the market. Success moving forward is likely to depend on discernment — directing capital toward quality businesses, emerging winners and genuine bargains, while avoiding the overhyped and overvalued. A more selective approach could become increasingly important if capital transfer accelerates between sectors in the years ahead — rotating from tech earnings and capex to companies anchored in tangible assets, durable cash flows and disciplined reinvestment.

Martin Romo is chair and chief investment officer of Capital Group. He is also an equity portfolio manager with 33 years of investment industry experience (as of 12/31/2025). He holds an MBA from Stanford and a bachelor's degree in architecture from the University of California, Berkeley.

Greg Miliotes is an equity portfolio manager at Capital Group. He also serves on the Capital Group Management Committee. He has 28 years of investment industry experience (as of 12/31/2025). Greg holds a master’s degree and certificate in global management and public management from Stanford Graduate School of Business and a bachelor’s degree in mechanical engineering from the Massachusetts Institute of Technology.

David Polak is an investment director with 42 years of investment industry experience (as of 12/31/2025). He holds a bachelor’s degree in economics from University College London, graduating with honors.

Victoria Quach is a senior client analytics manager with 18 years of industry experience (as of 12/31/2025). She holds a master's degree in financial engineering from the UCLA Anderson School of Management and a bachelor's degree in mathematics and applied science from the University of California, Los Angeles.

Past results are not predictive of results in future periods. It is not possible to invest directly in an index, which is unmanaged. The value of investments and income from them can go down as well as up and you may lose some or all of your initial investment. This information is not intended to provide investment, tax or other advice, or to be a solicitation to buy or sell any securities.
 
Statements attributed to an individual represent the opinions of that individual as of the date published and do not necessarily reflect the opinions of Capital Group or its affiliates. All information is as at the date indicated unless otherwise stated. Some information may have been obtained from third parties, and as such the reliability of that information is not guaranteed.
 
Capital Group manages equity assets through three investment groups. These groups make investment and proxy voting decisions independently. Fixed income investment professionals provide fixed income research and investment management across the Capital organisation; however, for securities with equity characteristics, they act solely on behalf of one of the three equity investment groups.