Marketing & Client Acquisition
Categories
Portfolio Construction
Insights from our review of 193 RIA portfolios in Q3 2023
From July 1 to September 30, 2023, Capital Group’s Portfolio Consulting and Analytics team analyzed 193 registered investment advisor (RIA) portfolios as part of its Portfolio Analysis Review service. The overall goal of these reviews is to help advisors gain a better understanding of how their portfolio exposure compares to their stated goals and objectives and to provide deeper insight on portfolio risk and positioning in the current environment. The team’s recent portfolio analyses highlight interesting data on dividend exposure in equity portfolios and duration in fixed income portfolios.
KEY TAKEAWAYS
- The equity sleeve of the average RIA portfolio remains underweight dividends when compared to an American Funds model portfolio with a similar asset allocation.
- Exposure to dividends matters today, especially given current valuations and heavy equity market concentration in growth and tech stocks.
- The fixed income sleeve of the average RIA portfolio is short duration, yet the expected end of Fed rate hikes makes it a good time to consider increasing duration through core and core-plus fixed income vehicles.
- Inflation uncertainty has kept stock/bond correlations relatively high, highlighting the need for other ways of assessing how well advisors’ fixed income exposures are diversifying equity positioning.
From July 1 to September 30, 2023, Capital Group’s Portfolio Consulting and Analytics team analyzed 193 RIA portfolios as part of its Portfolio Analysis Review service. The overall goal of these reviews is to help advisors gain a better understanding of how their portfolio exposure compares to their stated goals and objectives and to provide deeper insight on portfolio risk and positioning in the current environment. The team’s recent portfolio analyses highlight interesting data on dividend exposure in equity portfolios and duration in fixed income portfolios.
During our conversations with advisors, Capital Group’s portfolio specialists often hear about the leading operational challenges to running a successful practice, including the critical, but often time-consuming, nature of the investment process. Given the uncertainties around factor timing, inflation and terminal interest rates in the current environment, we believe advisors could be well-served by considering flexible allocation portfolios that entrust more decisions to an active manager.
Dividends matter today
The average RIA has a relatively high allocation to low- or no-dividend payers — which contributes to higher overall portfolio volatility. If advisors are interested in de-risking equity exposures and seeking to improve the quality of their portfolios, more dividend exposure may help.
Exposure to dividends matters today, especially given current valuations and heavy equity market concentration. We favor higher quality dividend payers (as measured by the debt rating of that company’s bonds) over those with the highest yields. Such characteristics may provide better downside protection during equity drawdowns. Look for dividend-focused equity strategies that take a rigorous approach to company selection and support overall portfolio goals.
RIA portfolios have limited exposure to high-dividend payers
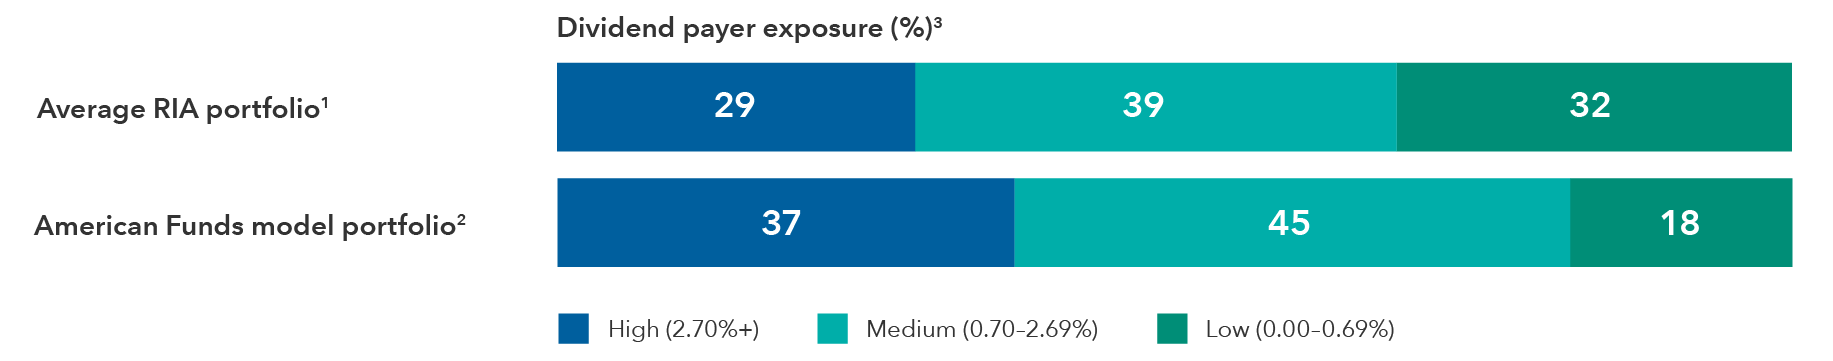
Sources: Capital Group, FactSet, and Morningstar. As of September 30, 2023.
Time to re-think duration?
Given expectations for eventual interest rate cuts after an aggressive period of monetary tightening, some investors are starting to shift out of short-maturity bonds into intermediate core and core-plus bonds. However, many advisors may not have enough core bond exposure and have been hesitant to extend duration, as shown in the table below.
Advisor portfolios are short duration
Portfolio |
BBB and below4 |
Effective duration |
|
|---|---|---|---|
Average RIA portfolio1 |
32% |
4.42 years |
|
American Funds model portfolio2 |
28% |
6.28 years |
Sources: Capital Group, FactSet, and Morningstar. Data as of September 30, 2023.
Cash and cash-like investments historically have decayed rapidly when Fed hikes end, while core, core-plus and municipal bond returns have typically outpaced cash-like investments in such periods. The rapid upward movement of yields over the last year makes it a good time to consider increasing duration through core fixed income vehicles. Core and core-plus approaches can provide flexibility through changing bond environments. These strategies are active approaches that can take advantage of longer duration opportunities while also improving credit quality.
Be mindful of fixed income diversification
Ongoing inflation uncertainty has kept stock/bond correlations high, and advisor portfolio correlations remain elevated in 2023. Higher correlations make equity risk mitigation more challenging. Stock/bond correlations are likely to come down as inflation uncertainty wanes, but in the interim advisors may want to assess how well their fixed income exposures are diversifying equity positioning.
Capital Group’s Portfolio Analysis Review service can examine rolling correlations, excess return correlations, scenario analysis and sector decomposition to gauge effective diversification of your portfolio and inform any potential changes to your fixed income exposures.
Stock/bond correlations remain high
Portfolio |
Correlation5 |
|
Average RIA portfolio1 |
0.54 |
|
American Funds model portfolio2 |
0.44 |
Sources: Capital Group, FactSet, and Morningstar. As of September 30, 2023.
Examine your clients’ portfolios to help improve efficiency and avoid common pitfalls
If you are an advisor seeking a detailed review of your clients’ portfolios, Capital Group can help. Request a personal consultation from one of our portfolio specialists to help benchmark your clients’ portfolios, address your clients’ specific investment needs and goals, and consider flexible portfolio solutions.
Learn more about
1 The average advisor portfolio is representative of the aggregate exposures of advisor portfolios analyzed by Capital Group’s Portfolio Consulting and Analytics team from July 1, 2023, to September 30, 2023.
2 American Funds model portfolio represents the most recent available data as of September 30, 2023. This model aligns closely to the broad asset allocation of the average RIA portfolio.
3 For American Funds, securities in the Unrated category have not been rated by a rating agency; however, the investment adviser performs its own credit analysis and assigns comparable ratings that are used for compliance with applicable investment policies.
4 Average 5-year correlation of the fixed income sleeve to the S&P 500.
To read the full article, become an RIA Insider. You'll also gain complimentary access to news, insights, tools and more.
Already an Insider?
Investments are not FDIC-insured, nor are they deposits of or guaranteed by a bank or any other entity, so they may lose value.
For financial professionals only. Not for use with the public.
Model portfolios are subject to the risks associated with the underlying funds in the model portfolio. Investors should carefully consider investment objectives, risks, fees and expenses of the funds in the model portfolio, which are contained in the fund prospectuses.
Bond ratings, which typically range from AAA/Aaa (highest) to D (lowest), are assigned by credit rating agencies such as Standard & Poor's, Moody's and/or Fitch, as an indication of an issuer's creditworthiness.
Investing outside the United States involves risks, such as currency fluctuations, periods of illiquidity and price volatility. These risks may be heightened in connection with investments in developing countries.
Nondiversified funds have the ability to invest a larger percentage of assets in securities of individual issuers than a diversified fund. As a result, a single issuer could adversely affect a fund's results more than if the fund invested a smaller percentage of assets in securities of that issuer. Refer to the applicable prospectus for details.
()
There have been periods when the results lagged the index(es) and/or average(s).
The indexes are unmanaged and, therefore, have no expenses. Investors cannot invest directly in an index.
Each S&P Index ("Index") shown is a product of S&P Dow Jones Indices LLC and/or its affiliates and has been licensed for use by Capital Group. Copyright © 2024 S&P Dow Jones Indices LLC, a division of S&P Global, and/or its affiliates. All rights reserved. Redistribution or reproduction in whole or in part is prohibited without written permission of S&P Dow Jones Indices LLC.
All Capital Group trademarks mentioned are owned by The Capital Group Companies, Inc., an affiliated company or fund. All other company and product names mentioned are the property of their respective companies.
Use of this website is intended for U.S. residents only.
Model portfolios are provided to financial intermediaries who may or may not recommend them to clients. The portfolios consist of an allocation of funds for investors to consider and are not intended to be investment recommendations. The portfolios are asset allocations designed for individuals with different time horizons, investment objectives, and risk profiles. Allocations may change and may not achieve investment objectives. If a cash allocation is not reflected in a model, the intermediary may choose to add one. Capital Group does not have investment discretion or authority over investment allocations in client accounts. Rebalancing approaches may differ depending on where the account is held. Investors should talk to their financial professional for information on other investment alternatives that may be available. In making investment decisions, investors should consider their other assets, income, and investments. Visit capitalgroup.com for current allocations.
This content, developed by Capital Group, home of American Funds, should not be used as a primary basis for investment decisions and is not intended to serve as impartial investment or fiduciary advice.
© 2024 Morningstar, Inc. All Rights Reserved. Some of the information contained herein: (1) is proprietary to Morningstar and/or its content providers; (2) may not be copied or distributed; and (3) is not warranted to be accurate, complete or timely. Neither Morningstar, its content providers nor Capital Group are responsible for any damages or losses arising from any use of this information. Past performance is no guarantee of future results. Information is calculated by Morningstar. Due to differing calculation methods, the figures shown here may differ from those calculated by Capital Group.
Investments are not FDIC-insured, nor are they deposits of or guaranteed by a bank or any other entity, so they may lose value.
Investors should carefully consider investment objectives, risks, charges and expenses.
This and other important information is contained in the fund prospectuses and summary prospectuses, which can be obtained from a financial professional and should be read carefully before investing.
Model portfolios are subject to the risks associated with the underlying funds in the model portfolio. Investors should carefully consider investment objectives, risks, fees and expenses of the funds in the model portfolio, which are contained in the fund prospectuses.
Bond ratings, which typically range from AAA/Aaa (highest) to D (lowest), are assigned by credit rating agencies such as Standard & Poor's, Moody's and/or Fitch, as an indication of an issuer's creditworthiness.
Investing outside the United States involves risks, such as currency fluctuations, periods of illiquidity and price volatility. These risks may be heightened in connection with investments in developing countries.
Nondiversified funds have the ability to invest a larger percentage of assets in securities of individual issuers than a diversified fund. As a result, a single issuer could adversely affect a fund's results more than if the fund invested a smaller percentage of assets in securities of that issuer. Refer to the applicable prospectus for details.
()
There have been periods when the results lagged the index(es) and/or average(s).
The indexes are unmanaged and, therefore, have no expenses. Investors cannot invest directly in an index.
Each S&P Index ("Index") shown is a product of S&P Dow Jones Indices LLC and/or its affiliates and has been licensed for use by Capital Group. Copyright © 2024 S&P Dow Jones Indices LLC, a division of S&P Global, and/or its affiliates. All rights reserved. Redistribution or reproduction in whole or in part is prohibited without written permission of S&P Dow Jones Indices LLC.
All Capital Group trademarks mentioned are owned by The Capital Group Companies, Inc., an affiliated company or fund. All other company and product names mentioned are the property of their respective companies.
Use of this website is intended for U.S. residents only.
Model portfolios are provided to financial intermediaries who may or may not recommend them to clients. The portfolios consist of an allocation of funds for investors to consider and are not intended to be investment recommendations. The portfolios are asset allocations designed for individuals with different time horizons, investment objectives, and risk profiles. Allocations may change and may not achieve investment objectives. If a cash allocation is not reflected in a model, the intermediary may choose to add one. Capital Group does not have investment discretion or authority over investment allocations in client accounts. Rebalancing approaches may differ depending on where the account is held. Investors should talk to their financial professional for information on other investment alternatives that may be available. In making investment decisions, investors should consider their other assets, income, and investments. Visit capitalgroup.com for current allocations.
Effective July 1, 2024, American Funds Distributors, Inc. was renamed Capital Client Group, Inc.
This content, developed by Capital Group, home of American Funds, should not be used as a primary basis for investment decisions and is not intended to serve as impartial investment or fiduciary advice.
© 2024 Morningstar, Inc. All Rights Reserved. Some of the information contained herein: (1) is proprietary to Morningstar and/or its content providers; (2) may not be copied or distributed; and (3) is not warranted to be accurate, complete or timely. Neither Morningstar, its content providers nor Capital Group are responsible for any damages or losses arising from any use of this information. Past performance is no guarantee of future results. Information is calculated by Morningstar. Due to differing calculation methods, the figures shown here may differ from those calculated by Capital Group.