Marketing & Client Acquisition
Categories
Portfolio Construction
Common gaps in RIAs’ portfolio objectives vs. execution
 Casey Dregits
 Royce Woodley
December 2, 2021
From July 1 to September 30, 2021, Capital Group’s portfolio consulting team analyzed the portfolios of 122 RIAs across the United States. This service, known as a Portfolio Analysis Review (PAR), helps advisors evaluate their portfolios and identify risks and potential enhancements. It’s a rigorous analysis built on principles of objective-based investing, global diversification and the various roles of fixed income in a portfolio.
Through our analyses, we discovered that RIAs’ portfolio construction often doesn’t align with their stated objectives. For example, while many advisors say that the primary goal of their fixed income portfolios is diversification from equity risk, we found that their fixed income portfolios often exhibit a high degree of correlation to equity index returns.
This is just one of several eye-opening findings we have gleaned from our regular reviews of RIAs’ portfolios. By recognizing these common mistakes and taking a fresh look at their portfolio construction process, RIAs can improve their ability to meet clients’ objectives.
KEY TAKEAWAYS
- Fixed income: RIAs focused on equity diversification often instead create highly correlated, income-focused portfolios.
- Growth versus value: Growth continues to dominate — even for distribution-focused portfolios.
- International equities: RIAs could benefit from a more nuanced approach to achieving geographic diversification.
From July 1 to September 30, 2021, Capital Group’s portfolio consulting team analyzed the portfolios of 122 RIAs across the United States. This service, known as a Portfolio Analysis Review (PAR), helps advisors evaluate their portfolios and identify risks and potential enhancements. It’s a rigorous analysis built on principles of objective-based investing, global diversification and the various roles of fixed income in a portfolio.
Through our analyses, we discovered that RIAs’ portfolio construction often doesn’t align with their stated objectives. For example, while many advisors say that the primary goal of their fixed income portfolios is diversification from equity risk, we found that their fixed income portfolios often exhibit a high degree of correlation to equity index returns.
This is just one of several eye-opening findings we have gleaned from our regular reviews of RIAs’ portfolios. By recognizing these common mistakes and taking a fresh look at their portfolio construction process, RIAs can improve their ability to meet clients’ objectives.
Fixed income: Diversification-focused RIAs often create highly correlated, income-focused portfolios
Although the vast majority of advisors state that equity risk diversification is the top objective for their fixed income portfolios, our analyses show that the average advisor’s fixed income allocation instead tends to be more focused on generating income. Failing to recognize this bias can lead advisors to take excessive risk in fixed income, which can be particularly painful when equity markets sell off or liquidity dries up as it did in early 2020.
There are several reasons why advisors may overlook that their fixed income allocations are heavily income focused. The sustained bull-market environment has caused many advisors’ portfolios to be overweight credit and lower quality fixed income. While this strategy has been successful for several years, it can quickly face challenges when risk increases. In fact, more than one-fifth of fixed income sleeves we analyzed had a correlation with equities greater than 60%; this is clearly too high a level if diversification from equity risk is the primary objective.
One way to counteract this blind spot is to look beyond credit ratings and use correlation and scenario analysis when examining a fixed income portfolio. In addition, research into the liquidity, sectors and credit quality of a portfolio can add value. These tools, which are core parts of Capital Group’s PAR service, can help advisors build fixed income portfolios that are better equipped to deliver on their clients’ objectives.
PAR analyses often show misalignment in fixed income portfolios
Our analyses of advisors’ fixed income portfolios show that portfolios with a stated goal of equity risk diversification are often highly correlated with equity index returns and/or focused on income. The charts below show the average RIA fixed income sleeve from the 122 RIA portfolios reviewed by Capital Group from July 1 to September 30, 2021.
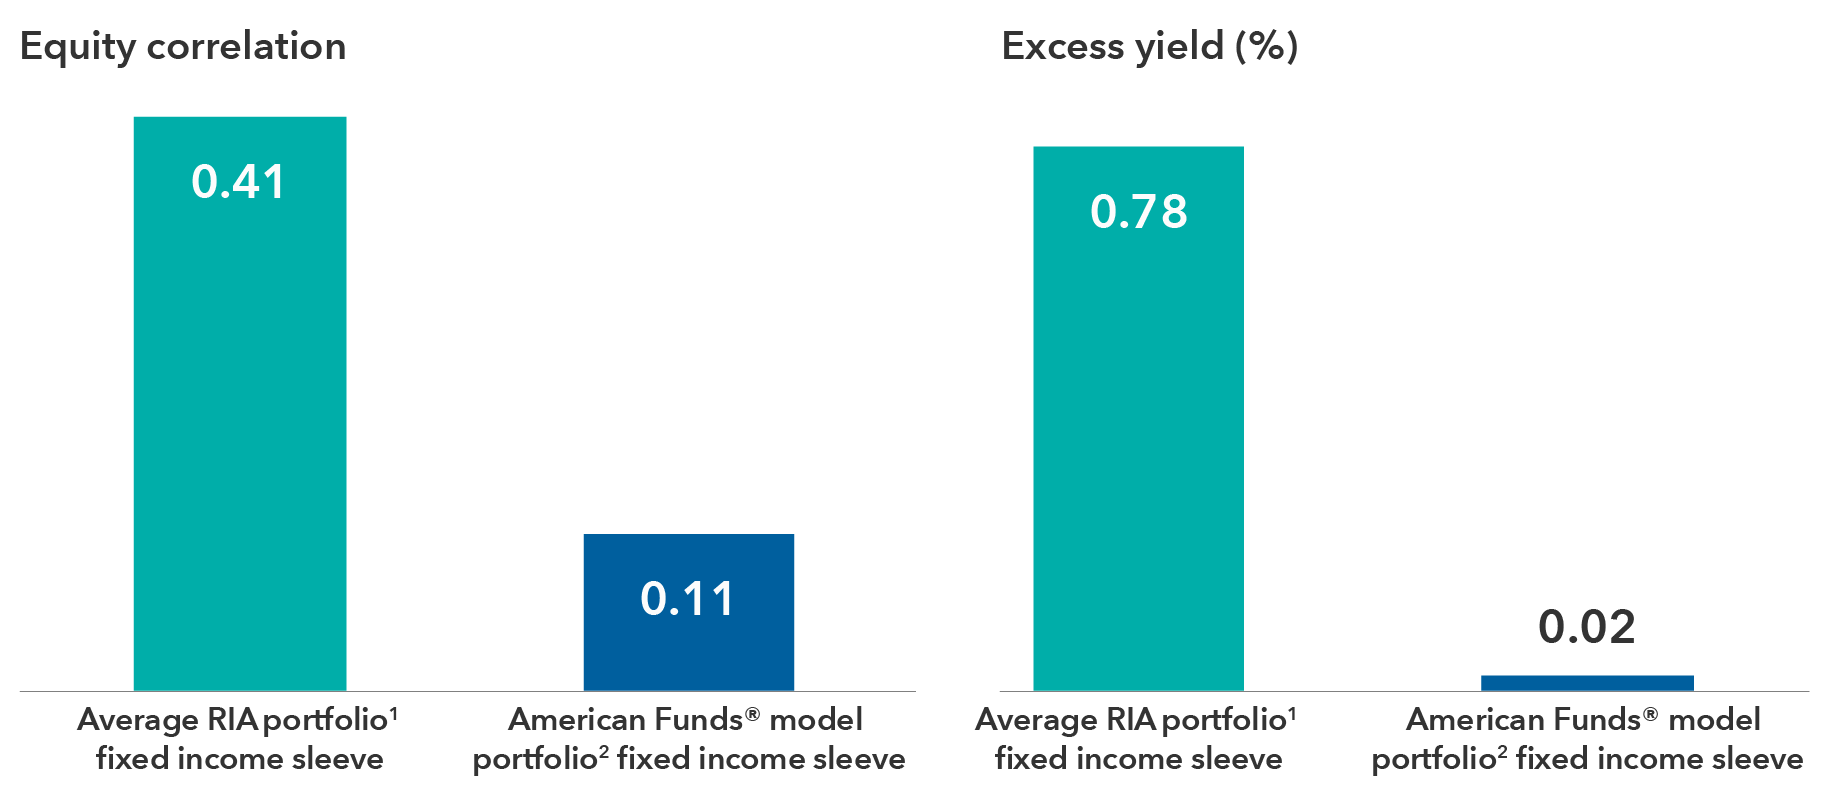
Source: Capital Group. Data as of September 30, 2021. Equity correlation represents three-year equity correlation to the S&P 500 Index. Excess yield represents 12-month yield of the fixed income sleeve minus the 12-month yield of an ETF vehicle that tracks the Bloomberg Aggregate Index and is net of fees.
Growth versus value: Growth has dominated — even for distribution-focused portfolios
Advisors’ portfolios generally were heavily tilted toward growth stocks in 2020 and early 2021. The pendulum shifted toward value in March 2021, but by July growth had again taken the lead. Even distribution-focused portfolios have shown a growth orientation; often the only significant difference between distribution portfolios and growth-of-capital portfolios is a slightly larger fixed income sleeve in distribution portfolios. With equity markets trading near historic highs from a price-to-earnings perspective, our analyses show that a P/E contractionary event would pose significant risk to many advisors’ portfolios and could be devastating for distribution portfolios in particular.
We encourage advisors to look beyond P/E ratios and stated dividend yields when analyzing value investments. For example, beta analysis can help determine how closely correlated value exposure has been to equities more broadly. This type of analysis can help advisors focus their value portfolios on high-quality companies with sustainable dividends, which should be better positioned to sustain a potential P/E contractionary event.
Value indexes may be “growthier” than you might expect
A value label doesn’t necessarily mean that advisors will gain the quality, non-growth exposure they seek. The chart below shows the percentage of stocks in the value index whose return exceeds the growth index median stock return for the year.
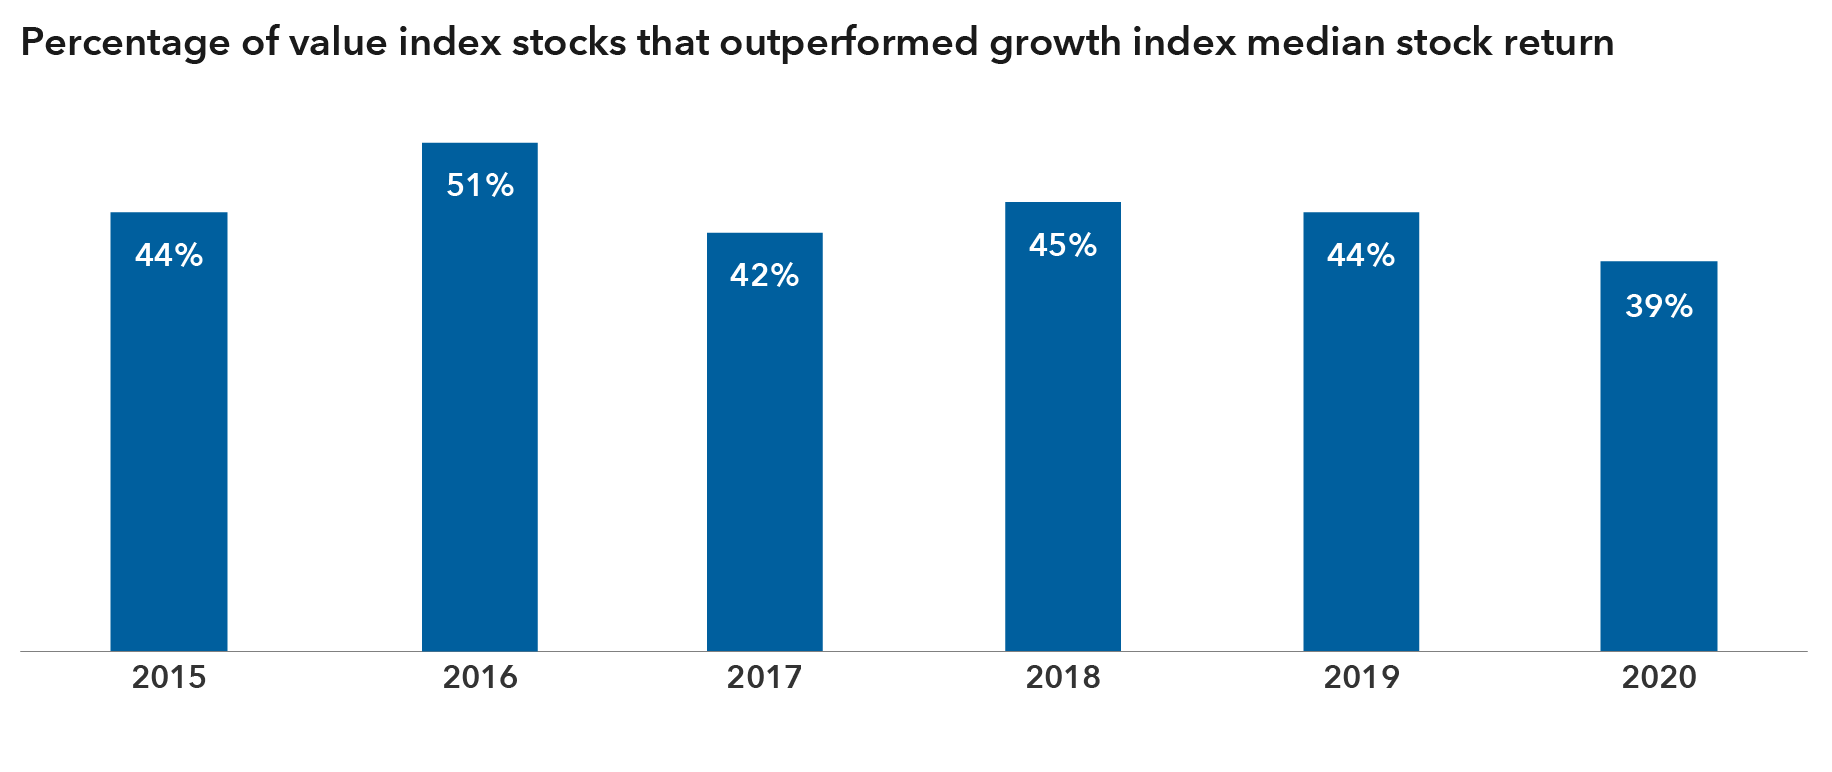
Source: MSCI World style indices. Data as of December 31, 2020.
International equities: Achieving geographic diversification requires a nuanced approach
The average equity portfolio evaluated by Capital Group allocates nearly three-quarters of portfolio capital to U.S. equities and just over one-quarter to non-U.S. equities. Advisors are particularly underweight international small- and mid-cap companies. This isn’t surprising because U.S. equities have recently outpaced international equities by a wide margin. In fact, we have recently neared all-time highs for U.S. outperformance relative to non-U.S. peers.
But there are reasons to believe that this trend may reverse in the near future. From a purely P/E perspective, international equities appear attractive relative to U.S. equities today. In addition, U.S. equities have been supported by a strong dollar environment during the past several years, and it is possible that we are moving into a devaluation period for the dollar. A weaker dollar environment would provide tailwinds for non-U.S. equities in the near term.
Before advisors increase exposure to international equities, it can be valuable to start with a more nuanced view of their current geographic diversification. Looking just at a company’s domicile can make it difficult to build the geographic diversification advisors seek with an appropriate level of precision. Analyzing the portfolio’s revenue generation by country, however, is a much more telling measure of how a portfolio’s exposure to business risk is spread across borders and provides a better foundation for making changes.
International exposure by company domicile versus company revenue
When analyzing international exposure through Capital Group’s PAR service, advisors are often surprised to discover that diversification by revenue is often widely different than diversification by domicile. Taking a more nuanced view of geographic diversification can enable advisors to more precisely achieve the diversification they seek. The charts below represent the average exposure among the 122 RIA portfolios reviewed by Capital Group from July 1 to September 30, 2021.
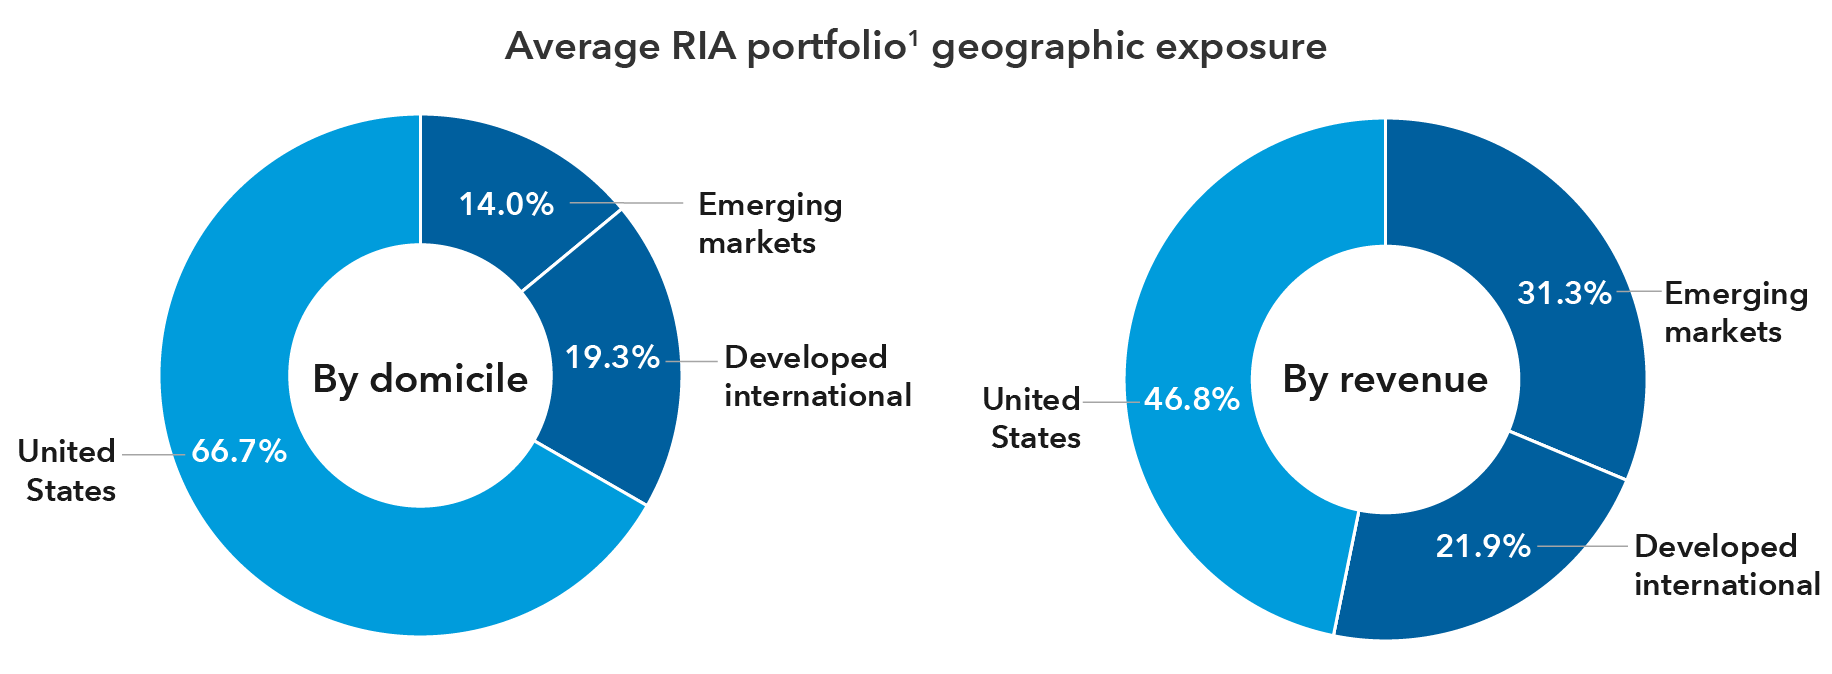
Source: Capital Group. Data as of September 30, 2021.
Examine your portfolios to avoid common pitfalls
Let us help you evaluate whether your portfolios are exhibiting the kinds of misalignment we frequently see, and find out how your portfolios stack up relative to those of other advisors.
If you are a financial professional interested in getting a portfolio checkup, Capital Group can help. Request a personal consultation with one of our portfolio specialists to help you address specific investment needs and goals surrounding your client portfolios.
Learn more about
Allocations may not achieve investment objectives. The portfolios' risks are directly related to the risks of the underlying funds.
MSCI World Index is a free float-adjusted market capitalization weighted index that is designed to measure equity market results of developed markets. The index consists of more than 20 developed market country indexes, including the United States.
Bloomberg Barclays U.S. Aggregate Index represents the U.S. investment-grade fixed-rate bond market.
Standard & Poor’s 500 Composite Index is a market capitalization-weighted index based on the results of approximately 500 widely held common stocks.
To read the full article, become an RIA Insider. You'll also gain complimentary access to news, insights, tools and more.
Already an Insider?
For financial professionals only. Not for use with the public.
Investments are not FDIC-insured, nor are they deposits of or guaranteed by a bank or any other entity, so they may lose value.
Investors should carefully consider investment objectives, risks, charges and expenses.
This and other important information is contained in the fund prospectuses and summary prospectuses, which can be obtained from a financial professional and should be read carefully before investing.
Model portfolios are subject to the risks associated with the underlying funds in the model portfolio. Investors should carefully consider investment objectives, risks, fees and expenses of the funds in the model portfolio, which are contained in the fund prospectuses.
Bond ratings, which typically range from AAA/Aaa (highest) to D (lowest), are assigned by credit rating agencies such as Standard & Poor's, Moody's and/or Fitch, as an indication of an issuer's creditworthiness.
Investing outside the United States involves risks, such as currency fluctuations, periods of illiquidity and price volatility. These risks may be heightened in connection with investments in developing countries.
The use of derivatives involves a variety of risks, which may be different from, or greater than, the risks associated with investing in traditional securities, such as stocks and bonds.
Lower rated bonds are subject to greater fluctuations in value and risk of loss of income and principal than higher rated bonds.
The return of principal for bond funds and for funds with significant underlying bond holdings is not guaranteed. Fund shares are subject to the same interest rate, inflation and credit risks associated with the underlying bond holdings.
Investing outside the United States involves risks, such as currency fluctuations, periods of illiquidity and price volatility. These risks may be heightened in connection with investments in developing countries.
Nondiversified funds have the ability to invest a larger percentage of assets in securities of individual issuers than a diversified fund. As a result, a single issuer could adversely affect a fund's results more than if the fund invested a smaller percentage of assets in securities of that issuer. Refer to the applicable prospectus for details.
Small-company stocks entail additional risks, and they can fluctuate in price more than larger company stocks.
The indexes are unmanaged and, therefore, have no expenses. Investors cannot invest directly in an index.
MSCI has not approved, reviewed or produced this report, makes no express or implied warranties or representations and is not liable whatsoever for any data in the report. You may not redistribute the MSCI data or use it as a basis for other indices or investment products.
Source: Bloomberg Index Services Limited. BLOOMBERG® is a trademark and service mark of Bloomberg Finance L.P. and its affiliates (collectively "Bloomberg"). Bloomberg or Bloomberg's licensors own all proprietary rights in the Bloomberg Indices. Neither Bloomberg nor Bloomberg's licensors approves or endorses this material, or guarantees the accuracy or completeness of any information herein, or makes any warranty, express or implied, as to the results to be obtained therefrom and, to the maximum extent allowed by law, neither shall have any liability or responsibility for injury or damages arising in connection therewith.
Each S&P Index ("Index") shown is a product of S&P Dow Jones Indices LLC and/or its affiliates and has been licensed for use by Capital Group. Copyright © 2024 S&P Dow Jones Indices LLC, a division of S&P Global, and/or its affiliates. All rights reserved. Redistribution or reproduction in whole or in part is prohibited without written permission of S&P Dow Jones Indices LLC.
Statements attributed to an individual represent the opinions of that individual as of the date published and do not necessarily reflect the opinions of Capital Group or its affiliates. This information is intended to highlight issues and should not be considered advice, an endorsement or a recommendation.
All Capital Group trademarks mentioned are owned by The Capital Group Companies, Inc., an affiliated company or fund. All other company and product names mentioned are the property of their respective companies.
Use of this website is intended for U.S. residents only. Use of this website and materials is also subject to approval by your home office.
Model portfolios are provided to financial intermediaries who may or may not recommend them to clients. The portfolios consist of an allocation of funds for investors to consider and are not intended to be investment recommendations. The portfolios are asset allocations designed for individuals with different time horizons, investment objectives, and risk profiles. Allocations may change and may not achieve investment objectives. If a cash allocation is not reflected in a model, the intermediary may choose to add one. Capital Group does not have investment discretion or authority over investment allocations in client accounts. Rebalancing approaches may differ depending on where the account is held. Investors should talk to their financial professional for information on other investment alternatives that may be available. In making investment decisions, investors should consider their other assets, income, and investments. Visit capitalgroup.com for current allocations.
Effective July 1, 2024, American Funds Distributors, Inc. was renamed Capital Client Group, Inc.
This content, developed by Capital Group, home of American Funds, should not be used as a primary basis for investment decisions and is not intended to serve as impartial investment or fiduciary advice.
Investments are not FDIC-insured, nor are they deposits of or guaranteed by a bank or any other entity, so they may lose value.
Investors should carefully consider investment objectives, risks, charges and expenses.
This and other important information is contained in the fund prospectuses and summary prospectuses, which can be obtained from a financial professional and should be read carefully before investing.
Model portfolios are subject to the risks associated with the underlying funds in the model portfolio. Investors should carefully consider investment objectives, risks, fees and expenses of the funds in the model portfolio, which are contained in the fund prospectuses.
The use of derivatives involves a variety of risks, which may be different from, or greater than, the risks associated with investing in traditional securities, such as stocks and bonds.
Lower rated bonds are subject to greater fluctuations in value and risk of loss of income and principal than higher rated bonds.
The return of principal for bond funds and for funds with significant underlying bond holdings is not guaranteed. Fund shares are subject to the same interest rate, inflation and credit risks associated with the underlying bond holdings.
Investing outside the United States involves risks, such as currency fluctuations, periods of illiquidity and price volatility. These risks may be heightened in connection with investments in developing countries.
Nondiversified funds have the ability to invest a larger percentage of assets in securities of individual issuers than a diversified fund. As a result, a single issuer could adversely affect a fund's results more than if the fund invested a smaller percentage of assets in securities of that issuer. Refer to the applicable prospectus for details.
Small-company stocks entail additional risks, and they can fluctuate in price more than larger company stocks.
Statements attributed to an individual represent the opinions of that individual as of the date published and do not necessarily reflect the opinions of Capital Group or its affiliates. This information is intended to highlight issues and should not be considered advice, an endorsement or a recommendation.
All Capital Group trademarks mentioned are owned by The Capital Group Companies, Inc., an affiliated company or fund. All other company and product names mentioned are the property of their respective companies.
Use of this website is intended for U.S. residents only.
Model portfolios are provided to financial intermediaries who may or may not recommend them to clients. The portfolios consist of an allocation of funds for investors to consider and are not intended to be investment recommendations. The portfolios are asset allocations designed for individuals with different time horizons, investment objectives, and risk profiles. Allocations may change and may not achieve investment objectives. If a cash allocation is not reflected in a model, the intermediary may choose to add one. Capital Group does not have investment discretion or authority over investment allocations in client accounts. Rebalancing approaches may differ depending on where the account is held. Investors should talk to their financial professional for information on other investment alternatives that may be available. In making investment decisions, investors should consider their other assets, income, and investments. Visit capitalgroup.com for current allocations.
Effective July 1, 2024, American Funds Distributors, Inc. was renamed Capital Client Group, Inc.
This content, developed by Capital Group, home of American Funds, should not be used as a primary basis for investment decisions and is not intended to serve as impartial investment or fiduciary advice.