Important information

This website is for Financial Intermediaries in Ireland only.


If you are an Individual Investor click here, if you are an Institutional Investor click here. Should you be looking for information for another location, please click here.


By clicking, you acknowledge that you have fully understood and accepted the Legal and Regulatory Information.

Global Affairs How the Iran war changes the economic outlook

War in Iran has injected new uncertainty into the global economy, reviving concerns that high oil prices could drive inflation up, strain consumer spending and weigh on economic growth.


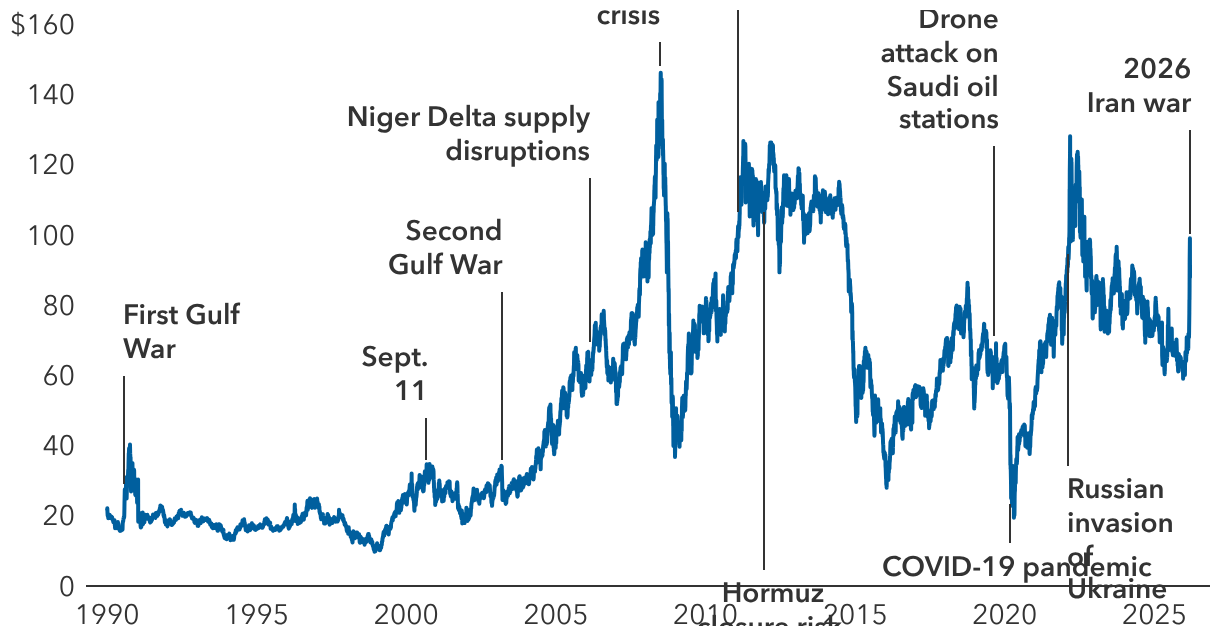
Prices for Brent crude and West Texas Intermediate (WTI) have zigzagged in recent days, hitting a high of nearly $120 a barrel as war escalated in the Middle East before quickly dropping below $100. As of 10 March, the global Brent price settled at $91.74 per barrel, roughly 26% higher than before the US strike on Iran.


About a fifth of the world’s oil supply moves through the Strait of Hormuz near Iran, so any disruption there will rapidly be reflected in fuel prices. Even in the United States, the world’s largest oil producer, the price of gasoline at the pump has jumped 20% since the US and Israel attacked Iran on 28 February.


“Consumers are quick to react to higher energy prices, often by dipping into savings and cutting back on gasoline use,” says US economist Jared Franz. If oil hovers near $85 a barrel through 2026, he estimates American’s purchasing power could fall by roughly 0.6%.


“The impact may be painful for consumers, but US GDP could remain on track to grow 2.8% this year, with unemployment stable in the range of 4% to 4.5%,” Franz says. “The global economy too, could show similar resilience with growth near 2.8%. But that baseline is fragile if the war drags on.”

Oil shocks have been common since the 1990s

Daily Brent crude price (USD per barrel)

Sources: Capital Group, Bloomberg. Figures reflect daily settlement prices between 1 January 1990, and 10 March 2026. Event dates are aligned to the nearest observable market price. If an event occurs on a non‑trading day, the prior trading day is used as the start date.

How long will the war last?


According to political economist Talha Khan, the duration of the war depends on how two competing timelines evolve. Khan explains the conflict as unfolding along “two clocks.” The first is an operational clock, which governs how long military action can be sustained, and the second is political, which reflects how long governments are willing — or able — to tolerate escalation.


Clock one: Military operations could drag on


The operational clock is defined by military sustainability, including missile inventories and logistics resilience. By that measure, “current patterns suggest both sides have prepared for duration,” Khan says.


Iran’s layered missile strategy is built around attrition and exhaustion rather than immediate shock. Israel and US targeting reflects a multi-stage effort to degrade capabilities, rather than a short punitive strike.


“US and Israeli strikes on Iran and have entered an attritional phase marked by sustained combat rather than rapid resolution,” Khan says. “They have achieved many operational successes, but that is not the same as strategic success.”


Clock two: The US has a short political window


The political clock diverges sharply depending on the country. Iran’s tolerance for pain appears the highest, even though it is operationally weaker, according to Khan. “The regime views the conflict through an existential lens, meaning capitulation on terms dictated by its enemies would undermine its ideological foundation and long-term strategic aims.”


The United States political clock is much shorter as President Trump has historically shown limited tolerance for protracted wars. “Domestic politics, market sensitivity, fiscal considerations, and competing global commitments are constraining open-ended escalation,” adds Khan.


“The Gulf states, meanwhile, have the lowest tolerance threshold. This is not their war, yet they face immediate exposure through energy infrastructure, shipping lanes, and capital markets.”


“Thus, while the military campaign may have room to continue, political patience may wear thin more quickly. When political and military timelines diverge, the risk of miscalculation or sudden escalation tends to rise, deepening economic uncertainty.”

US stock markets often recovered from geopolitical oil disruptions

A bar chart shows the average percentage change in the S&P 500 Index following seven geopolitical related oil supply disruptions between 1990 and 2024 over different time horizons. Average returns across these periods are slightly negative after two days and two weeks, modestly positive after two months, rise to about 12% after one year, and increase to roughly 32% after two years following supply shocks.

Sources: Capital Group, Bloomberg, Standard & Poor's. Specific geopolitical events that are reflected in average returns figures include: First Gulf War (August 1990), Second Gulf War (March 2003), Niger Delta supply disruptions (February 2006), Arab Spring and Libyan Civil War (February 2011), Hormuz closure risk and Iran sanctions (December 2011), drone attack on Saudi oil stations (September 2019), Russian invasion of Ukraine (February 2022). Event dates are aligned to the nearest observable market price ("T"). If a shock occurs on a non‑trading day, the prior trading day is used as the start date. Horizon returns are measured using the first available trading day on or after the stated calendar horizon (e.g., "T+2 days"). Past results are not predictive of results in future periods. Figures reflect total returns. As of 10 March 2026.

Risks of a long war


The costs would only compound the longer the war drags on. “The Strait of Hormuz is a major chokepoint for not just oil and liquefied natural gas, but also for petrochemicals that feed into fertiliser supply chains, shipping, chemicals, mining, and manufacturing,” explains Khan. “Beyond energy, cities in the region like Dubai and Doha serve as global nodes for capital flows, air travel and commercial freight.”


A widening conflict would trigger a classic risk-off response: higher oil prices, weaker equities, a stronger US dollar, widening credit spreads, and a rally in sovereign bonds as investors seek safety. “In more extreme cases, if oil prices rise enough to materially slow demand, the dynamic can shift toward stagflation, characterised by higher near-term inflation followed by weaker growth,” Khan adds.


Europe is among the most vulnerable advanced economies because it remains structurally dependent on imported energy. A sustained rise in oil prices would lift headline inflation relatively quickly and complicate the European Central Bank’s policy path, particularly if growth remains subdued. Japan is also highly sensitive due to its reliance on imported energy and the importance of exchange rates.


“In the US, oil at $120 a barrel would be enough to cut GDP growth by 1.5 percentage points to around 1% or less,” Franz says. “This would also likely lead to a global energy-induced recession.”


A manageable shock, for now


The Iran conflict presents a major but still manageable risk to the global economy — if it does not extend significantly in duration or scope, Franz notes. “The upcoming US midterm elections and downside risks to the economy could limit President Trump’s tolerance for a prolonged war.”


There is no single global outcome, Khan believes. Some economies, such as the United States and parts of Latin America, are relatively insulated due to domestic energy production. Others — including Europe, Japan, and much of Asia — are more exposed to sustained price increases and supply chain interruptions.


“Ultimately, the key question is how long the two clocks run. If the political timeline forces an earlier resolution, economic damage may remain limited,” Khan says. “If not, investors should prepare for a period of higher energy prices, slower growth and persistent volatility.”

Talha Khan is a political economist responsible for covering the eurozone and broader geopolitical issues. He has 17 years of investment industry experience (as of 12/31/2025). He holds a master’s degree in international political economy from the London School of Economics and Political Science and a bachelor’s degree in economics and political science from Macalester College.

Jared Franz is an economist with 20 years of investment industry experience (as of 12/31/2025). He holds a PhD in economics from the University of Illinois at Chicago and a bachelor’s degree in mathematics from Northwestern University.

Jayme Colosimo is an investment director with 25 years of investment industry experience (as of 12/31/2025). She holds an MBA and a bachelor’s degree in international business from Westminster College.

Past results are not predictive of results in future periods. It is not possible to invest directly in an index, which is unmanaged. The value of investments and income from them can go down as well as up and you may lose some or all of your initial investment. This information is not intended to provide investment, tax or other advice, or to be a solicitation to buy or sell any securities.
 
Statements attributed to an individual represent the opinions of that individual as of the date published and do not necessarily reflect the opinions of Capital Group or its affiliates. All information is as at the date indicated unless otherwise stated. Some information may have been obtained from third parties, and as such the reliability of that information is not guaranteed.
 
Capital Group manages equity assets through three investment groups. These groups make investment and proxy voting decisions independently. Fixed income investment professionals provide fixed income research and investment management across the Capital organisation; however, for securities with equity characteristics, they act solely on behalf of one of the three equity investment groups.