Liability-Driven Investing


This article is part of our Retirement Plan Trends series, which explores issues affecting the retirement space.
Pension risks are asymmetrical: There are limited benefits for plan sponsors from having a funded-status surplus beyond a certain point, but major drawbacks from any funded-status declines. Finally, after years of contributions, many plans are now fully funded or overfunded after capitalizing on a 10-year equity bull market and reaping the benefits of the recent rise in interest rates. As such, we would argue that the current environment is a prime opportunity for plans to de-risk to guard against downside funded-status outcomes.
Pension asymmetry: A key concept in risk management
The concept of pension asymmetry effectively refers to the skewed distribution of implications for a plan sponsor from changes in funded status. Put another way, there are typically limited benefits to sponsors in having a pension surplus beyond a certain point (say, 110% funded)1, but there can be significant negative implications to the sponsor as funded status falls.
Given this, plans at or approaching their funded-status objectives may want to consider more aggressive de-risking and shift their focus to protecting against downside funding outcomes. Other metrics such as surplus volatility need to take a back seat to focus on stress-testing worst-case outcomes.
The funded status journey: Marginal gain, with potentially significant pain
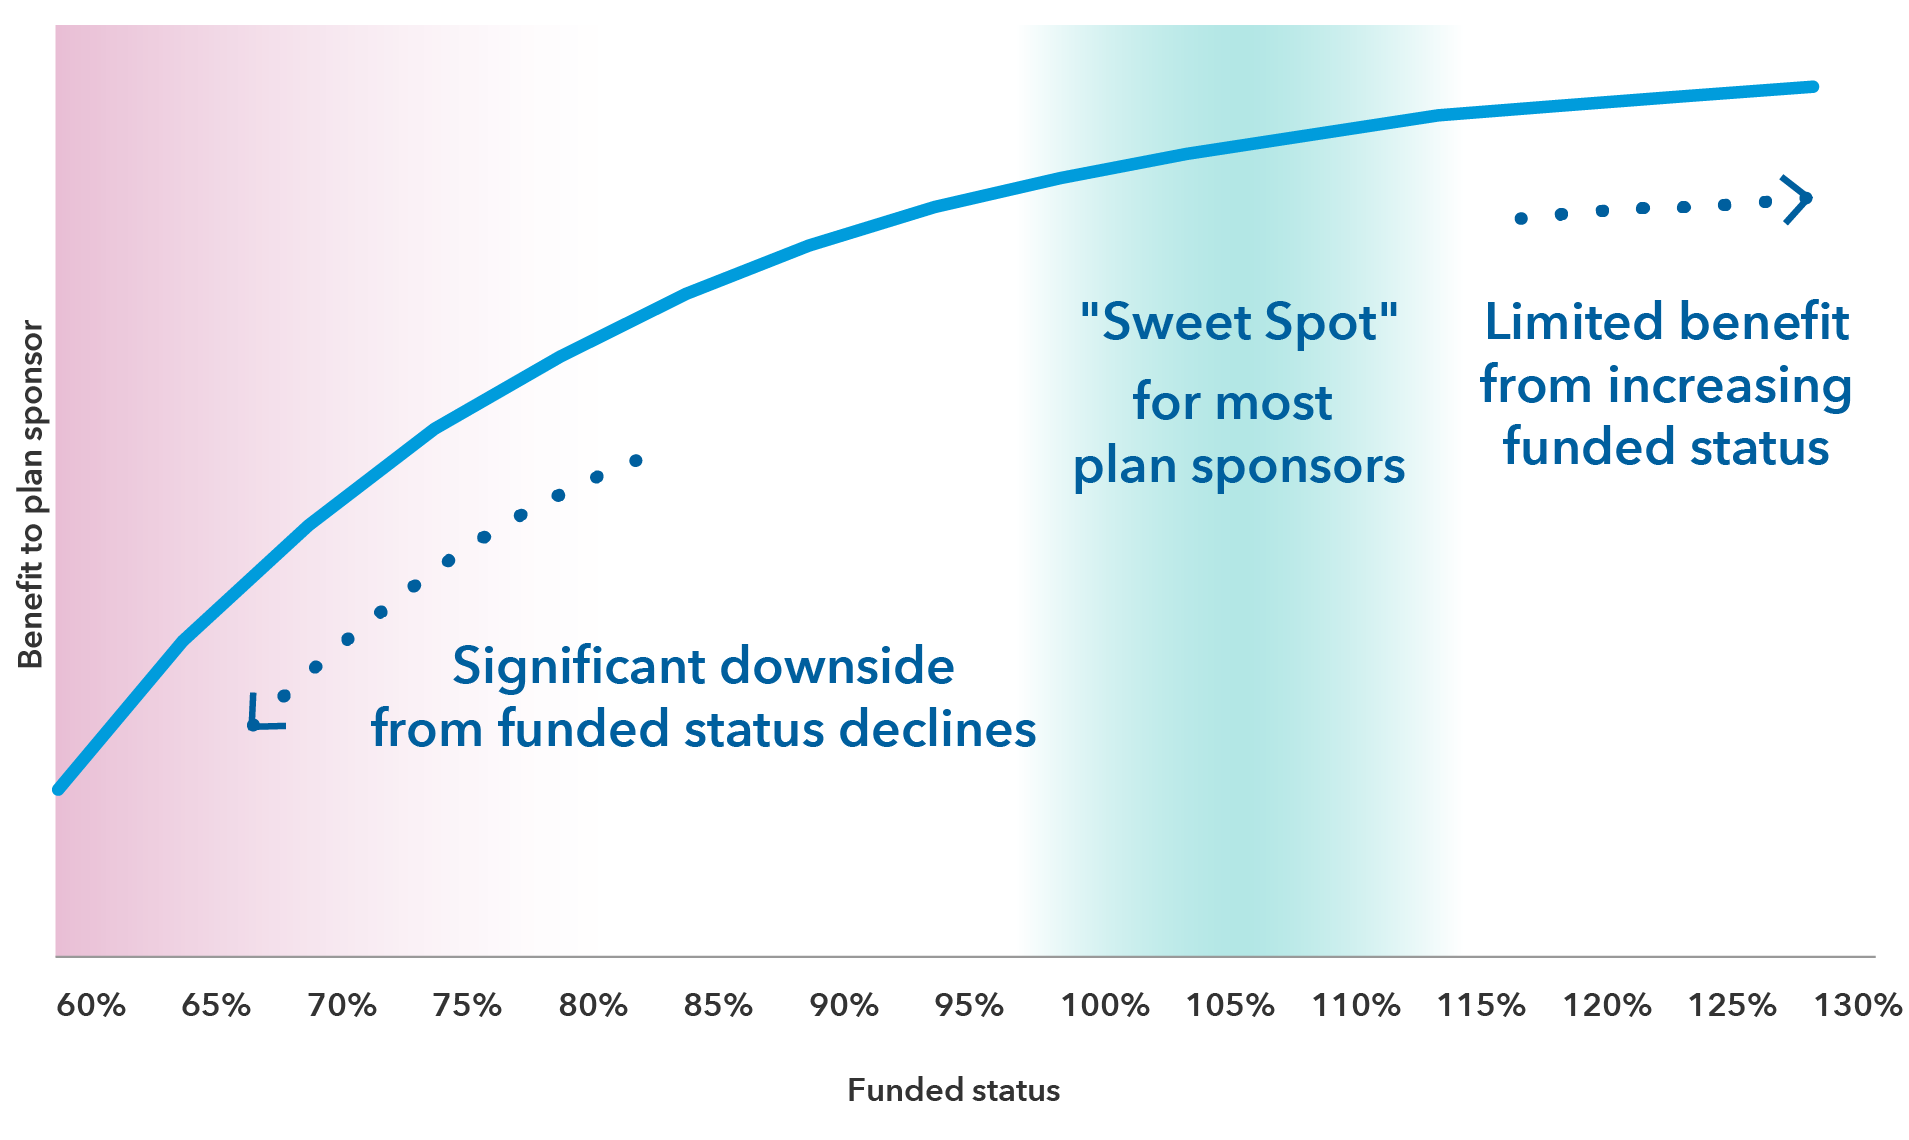
Source: Capital Group. For illustrative purposes only.
The potential perils of declining funded status
With a more focused and aggressive de-risking approach, plan sponsors can seek to enhance benefit security for plan participants, while minimizing a variety of negative impacts from declining funded status. Of course, declining funded status can have varying impacts on companies depending on the structure of their pension plans, the scale of the plan in the context of the broader business and other factors. Nonetheless, funded-status deterioration represents a potential challenge across plan sponsors. The table below highlights some of these potential impacts and their implications.
Potential negative consequences of declining funded status
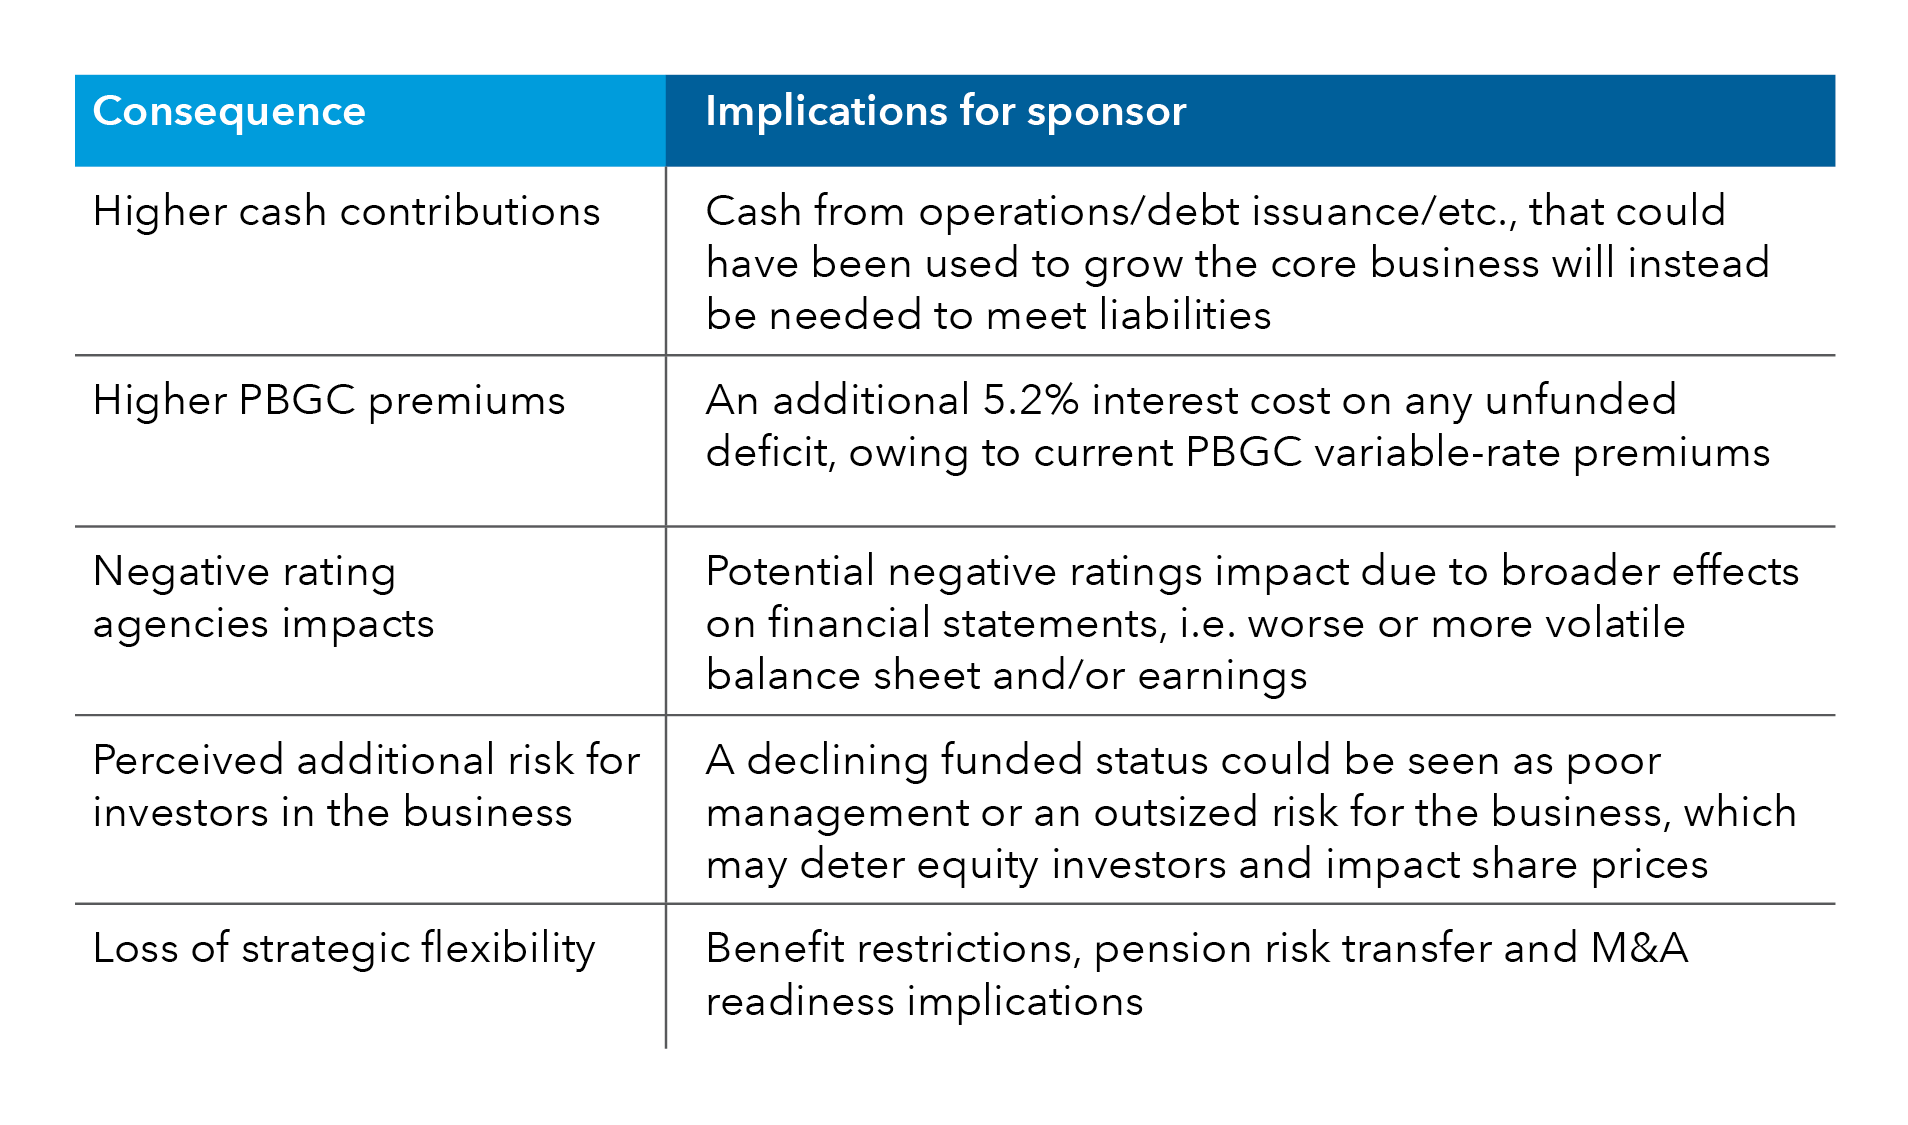
Source: Capital Group. PBGC: Pension Benefit Guaranty Corporation. M&A: mergers and acquisitions. PBGC variable-rate premium rate was 5.2% as of April 30, 2023. Definitions of terms used in this table and elsewhere in the text can be found at the end of this article.
Asset allocation to protect on the downside
Corporate pension plan management has always been a risk management exercise. Plans must balance seeking return, taking risks and managing for the downside, among other factors, when making asset allocation decisions. However, in certain environments and conditions, it can be imperative to prioritize some objectives over others. Considering the limited upside benefits for fully funded plans, and the potential negative consequences of declining funded status that have been laid out above, we argue that managing downside risk is the most important objective for most plan sponsors in the current environment.
Asset allocation plays a key role in protecting from the downside. Sponsors should look to make allocation decisions that minimize the probability of the funded status dipping below a certain point (100%, for example). One clear option for sponsors would be a shift in focus to liability-driven investing (LDI), with larger allocations to long duration credit as sponsors reduce their broader equity/return-seeking portfolio. We performed a basic analysis of three different asset allocations to demonstrate the impact exposure to LDI can have on a portfolio’s funded status in times of market stress.
Putting concept into context: a plan case study
For this analysis, we took a hypothetical plan that has a funded ratio of 110% — what we view as the “sweet spot” for most plan sponsors. We gave the plan three asset allocation options, with varying exposure to equities, long credit and long government bonds. We then stress-tested the three portfolios against two of the biggest down markets of the past two decades: the credit crunch of 2007-08 and the dot-com bubble of 2000-01.
The chart below shows the impact these negative scenarios would have on the various portfolios, using scenario analysis to recreate the market conditions in these environments. As we would expect, each portfolio would have felt the impact of market volatility and a decreased funded status, but the degree of decline varies notably depending on asset allocation.
The first portfolio, with a 60% allocation to equity and a 20% allocation to long credit, would have resulted in the plan’s funded status falling by 19 to 27 percentage points during these downturns. Conversely, by choosing the portfolio with only 20% in equity and 60% in long credit, the plan would have been able to maintain its fully funded status in either scenario.
Stress testing – the impact of down markets on plan portfolios
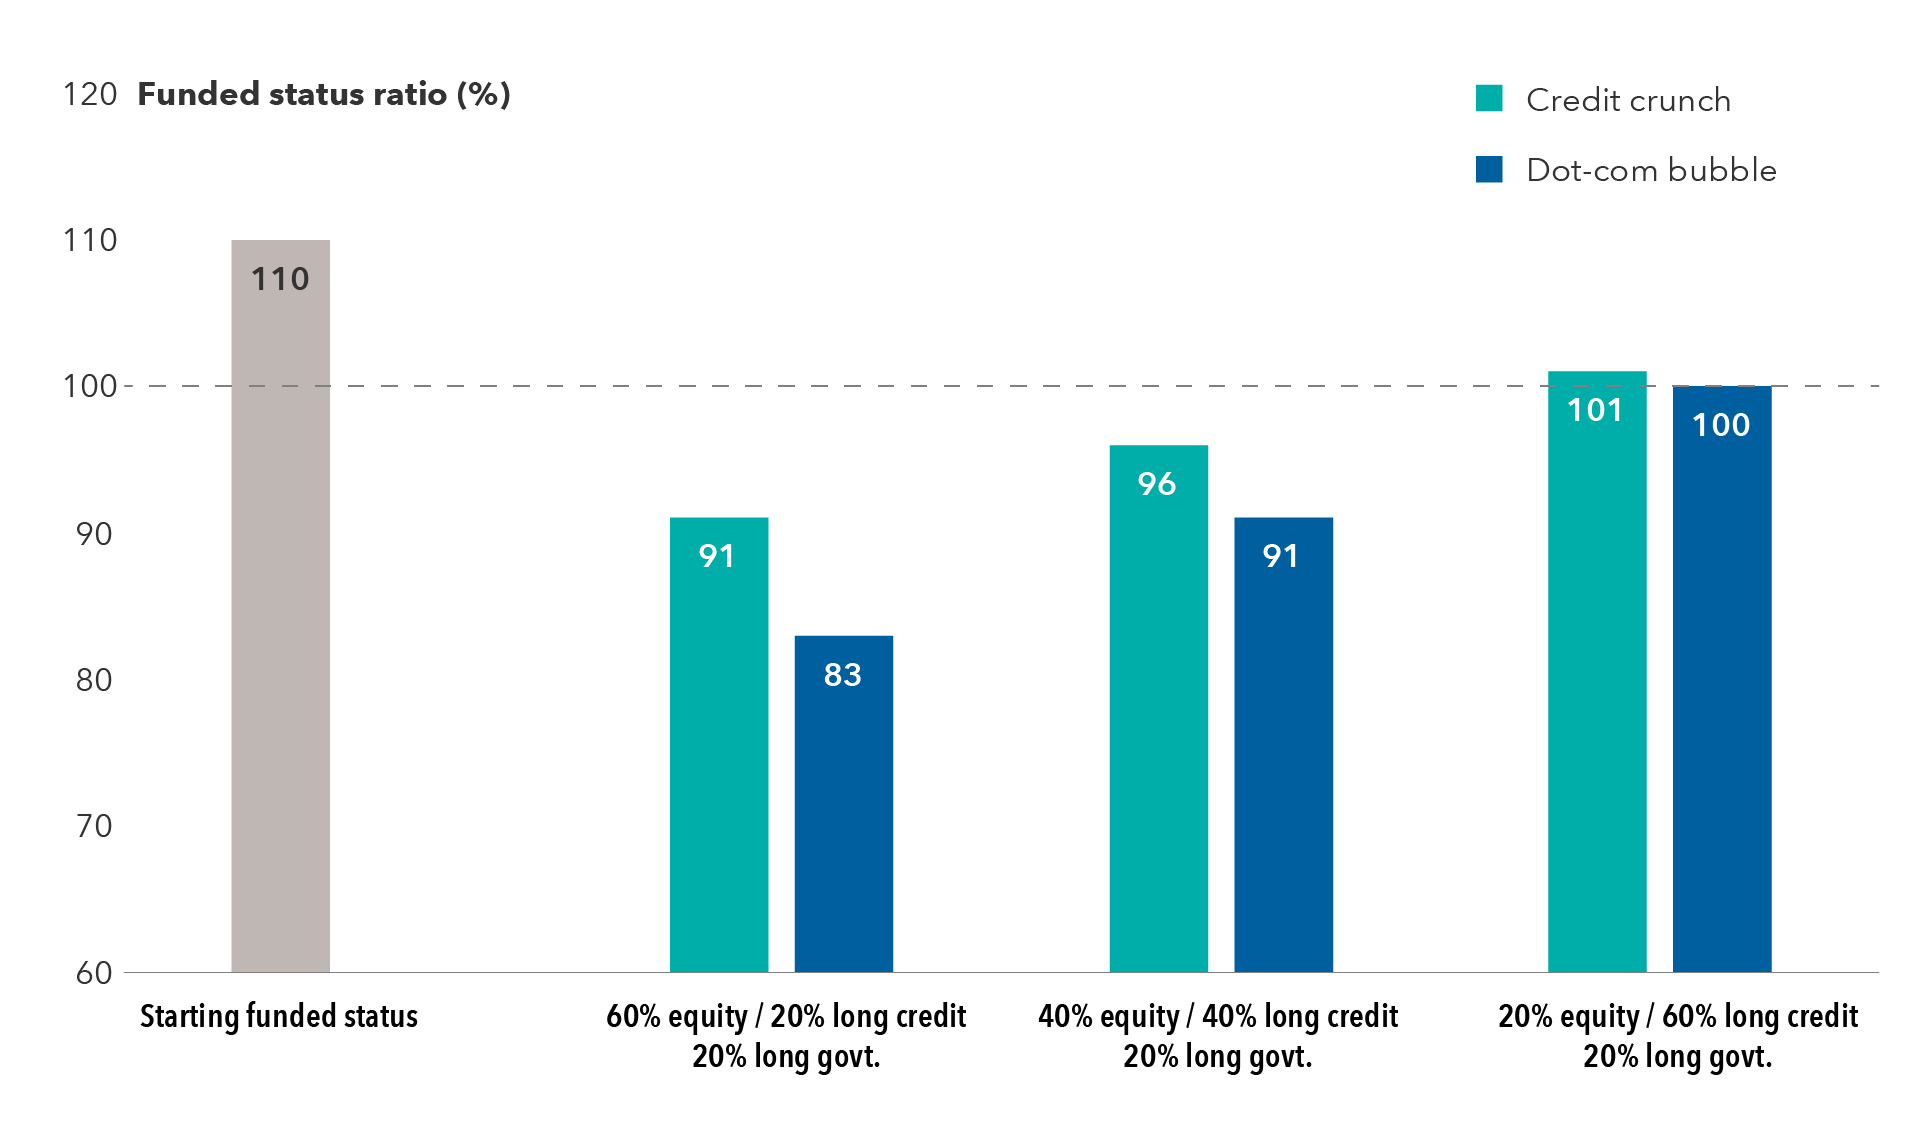
Sources: Capital Group, Moody’s (PFaroe) Analytics. Data as of December 31, 2022. Hypothetical and for illustrative purposes only, based on scenario analysis calculations from Moody’s (PFaroe) Analytics. Date ranges: Credit crunch: 7/16/07-11/6/08; Dot-com bubble: 3/21/00-9/20/01. Indices used to represent portfolios in Capital Group calculations were S&P 500 Index, Bloomberg U.S. Long Credit Index and Bloomberg U.S. Long Government Index.
Of course, this example is fairly high level and does not account for all factors. But it demonstrates the importance and potential downside of stressed environments that could prove debilitating for plan sponsors.
Don’t miss the opportunity to de-risk
To explore this topic further, read our white paper.
The current environment provides many sponsors with an opportunity to shift their focus toward de-risking while their plans are now fully funded or overfunded. By prioritizing de-risking, plan sponsors can seek to minimize the impact of negative consequences of a falling funded status, such as exposure to variable-rate PBGC premiums. Reconsidering the asset allocations can help position plan portfolios for this important objective.
Stay informed with our latest insights.
Our latest insights
-
Defined Contribution
-
Defined Benefit
-
Liability-Driven Investing
-
Defined Benefit
-
Regulation & Legislation
1. Source: Milliman. Data as of February 8, 2023. The Milliman 100 Pension Funding Index funded ratio was at 109.3%.
The Bloomberg U.S. Long Credit Index is a market-value weighted index that tracks the total return results of publicly issued U.S. corporate and specified foreign debentures and secured notes that meet the specified maturity, liquidity, and quality requirements, with maturities of ten years or more. To qualify, bonds must be SEC-registered and must be an investment-grade security. This index is unmanaged, and its results include reinvested distributions but do not reflect the effect of sales charges, account fees, expenses or U.S. federal income taxes.
The Bloomberg U.S. Long Government Index is a market-value weighted index that tracks the total return results of U.S. Treasury and U.S. agency (government owned, government sponsored and government guaranteed) bonds, with maturities of ten years or more. This index is unmanaged, and its results include reinvested distributions but do not reflect the effect of sales charges, account fees, expenses or U.S. federal income taxes.
Funded ratio reflects a pension fund’s current financial position, expressing the ratio between available assets and liabilities.
Funded status is a measure of the difference between the fair value of a plan’s assets and its benefit obligation.
Liability-driven investing (LDI) is an approach that focuses the investment policy and asset allocation decisions on matching a pension plan’s current and future liabilities.
Long credit refers to investment-grade, U.S. dollar-denominated, fixed-rate, taxable corporate and government-related debt with at least ten years to maturity.
Long government refers to government debt with at least ten years to maturity.
PBGC premiums refer to the pension insurance premiums set by Congress. Sponsors of defined benefit pension plans pay annual premiums to the Pension Benefit Guaranty Corporation (PBGC) for the cost of insuring pension benefits.
S&P 500 Index is a market capitalization-weighted index based on the results of approximately 500 widely held common stocks. This index is unmanaged, and its results include reinvested dividends and/or distributions but do not reflect the effect of sales charges, commissions, account fees, expenses or U.S. federal income taxes.
The value of fixed income securities may be affected by changing interest rates and changes in credit ratings of the securities.
Source: Bloomberg Index Services Limited. BLOOMBERG® is a trademark and service mark of Bloomberg Finance L.P. and its affiliates (collectively “Bloomberg”). Bloomberg or Bloomberg’s licensors own all proprietary rights in the Bloomberg Indices. Neither Bloomberg nor Bloomberg’s licensors approves or endorses this material, or guarantees the accuracy or completeness of any information herein, or makes any warranty, express or implied, as to the results to be obtained therefrom and, to the maximum extent allowed by law, neither shall have any liability or responsibility for injury or damages arising in connection therewith.
Each S&P Index (“Index”) shown is a product of S&P Dow Jones Indices LLC and/or its affiliates and has been licensed for use by Capital Group. Copyright © 2023 S&P Dow Jones Indices LLC, a division of S&P Global, and/or its affiliates. All rights reserved. Redistribution or reproduction in whole or in part is prohibited without written permission of S&P Dow Jones Indices LLC.