Defined Benefit
- A confluence of macro and fundamental factors makes us positive on emerging markets over the medium term.
- We believe emerging markets can be an important core component of the growth allocation for public pension funds as they seek to achieve expected return targets.
- The next phase of growth will likely be different from the past. We expect markets such as India, Indonesia and Mexico to grow in stature and market share.
- China is expected to remain an integral part of the global economy and the emerging markets universe. But as China’s economy matures, the next phase of growth will likely be driven by consumers.
- A combination of growth areas such as technology and health care, and dividend-oriented industries such as telecommunications, mining and banking, should make for a well-rounded opportunity set.
Allocating to growth assets remains a priority for many public pension plans as they seek strong returns to close funding deficits, absorb the cost of future benefit accruals and rationalize return targets. Average public pension plan funding has recently returned to pre-pandemic levels of around 73%.1 As they focus on return targets for their plans, public plan sponsors have allocated about two-thirds of assets (67%) to growth.2 They have also increased their allocations to alternatives, from about 12% of assets in 2010 to more than 20% today.
While alternative strategies may continue to play a role in plan funding, emerging markets (EM) could provide more liquid investment opportunities that should benefit from improving macroeconomic dynamics, such as declining policy and market interest rates, potential currency tailwinds and low valuations. Against this backdrop, target allocations to emerging markets average 5%,3 according to data from eVestment on the public pension funds universe. This is well below the MSCI ACWI weight of 11%.
Meanwhile, projected returns for both EM equities and debt exceed the expected return target of 7% for most public pensions. Many asset managers, including us, have increased their capital market assumptions for both EM equities and debt. Our 20-year expected returns are 9.0% annualized for emerging markets equities and 7.6% for emerging markets debt, per Capital Group’s forecast published at the beginning of 2023.4
We believe the outlook for EM is constructive over the medium term. The post-COVID-19 era has seen a reset in financial markets on many levels — interest rates, geopolitics and growth paradigms. It has also led to a redrawing of the landscape for emerging markets.
We also think the next phase of growth for EM will be different than the past 20 years. China’s economy has matured and is going through a difficult patch of reforms. Geopolitical tensions and the world’s energy transition are driving foreign investment into a broader mix of developing countries for manufacturing and natural resource needs. And government-led reforms are changing the trajectory of some developing countries, such as India and Indonesia.
Here we discuss the macro variables as well as some of the trends and opportunities we are seeing across markets and industries as they relate to EM equities.
Macro headwinds could become tailwinds
1. Inflation and interest rates are on a downward trend
Central banks in many developing countries, notably in Latin America, raised rates ahead of the U.S. Federal Reserve to blunt the impact of inflation. Most EMs lacked the ability to undertake quantitative easing over the last decade, which buffeted growth rates in developed markets. As inflation slows across some EMs, central banks in these markets are likely to pivot toward rate cuts in the coming months and quarters. Many have already started the process, including Brazil, Chile, Hungary and China.
A decline in rates and inflationary pressures should provide a boost to economies and in turn to cyclical areas of the market. Monetary authorities will have to balance pressure on their currencies from declining interest rates against the boost to domestic economies. On balance, we believe lower inflationary pressures and declining rates should be positive for EM economies and stock markets.
Countries across Latin America have been more aggressive in tackling inflation
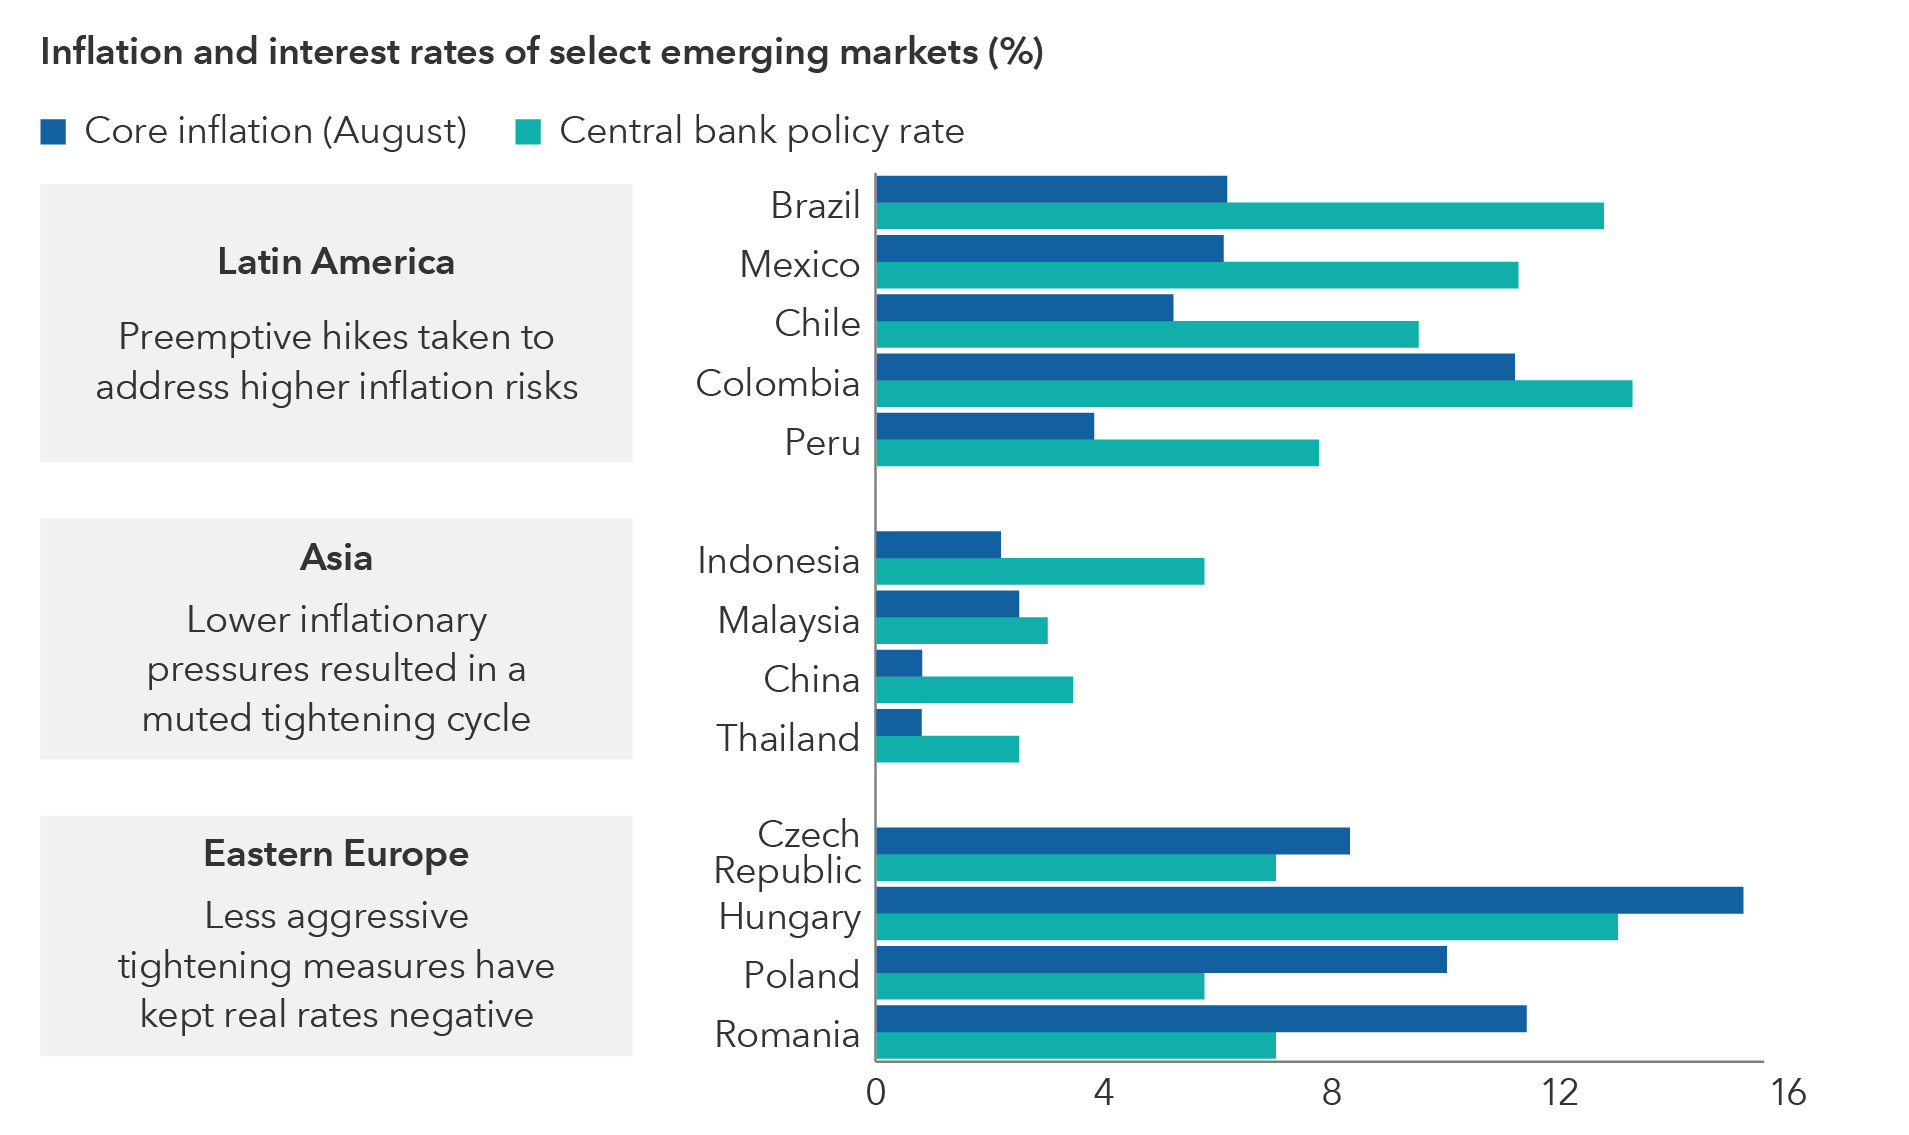
Sources: Capital Group, Bloomberg Index Services, Ltd. Core inflation is represented by the year-over-year change in consumer price index (CPI) excluding food and energy across countries. Inflation rates as of August 2023. Central bank policy rates as of October 5, 2023. Real interest rates equal the nominal core interest rate less inflation and reflect the true cost of funds to a borrower.
2. Economies are fundamentally stronger
The economic profile of many EM countries is much better than it was a decade ago. Government balance sheets are stronger. In 2021, the current account surpluses of developing economies totaled $480 billion, more than triple the amount recorded for 2019. And during COVID, unlike in many developed markets, policymakers in developing countries did not distribute large social welfare payments to individuals, which helped their fiscal position.
Government reforms have improved the ease of doing business in countries like India. India’s government has ushered in pro-business reforms and a digital identification system that have accelerated growth by facilitating the expansion of credit and bringing large swaths of the economy into the formal sector. Production-linked incentive programs designed to elevate India’s domestic manufacturing base are also gaining traction.
Indonesia has built more airports, roads and seaports, opened more industries to foreign investment and sought to cut red tape by making changes to labor and tax laws.
EMs then vs. now
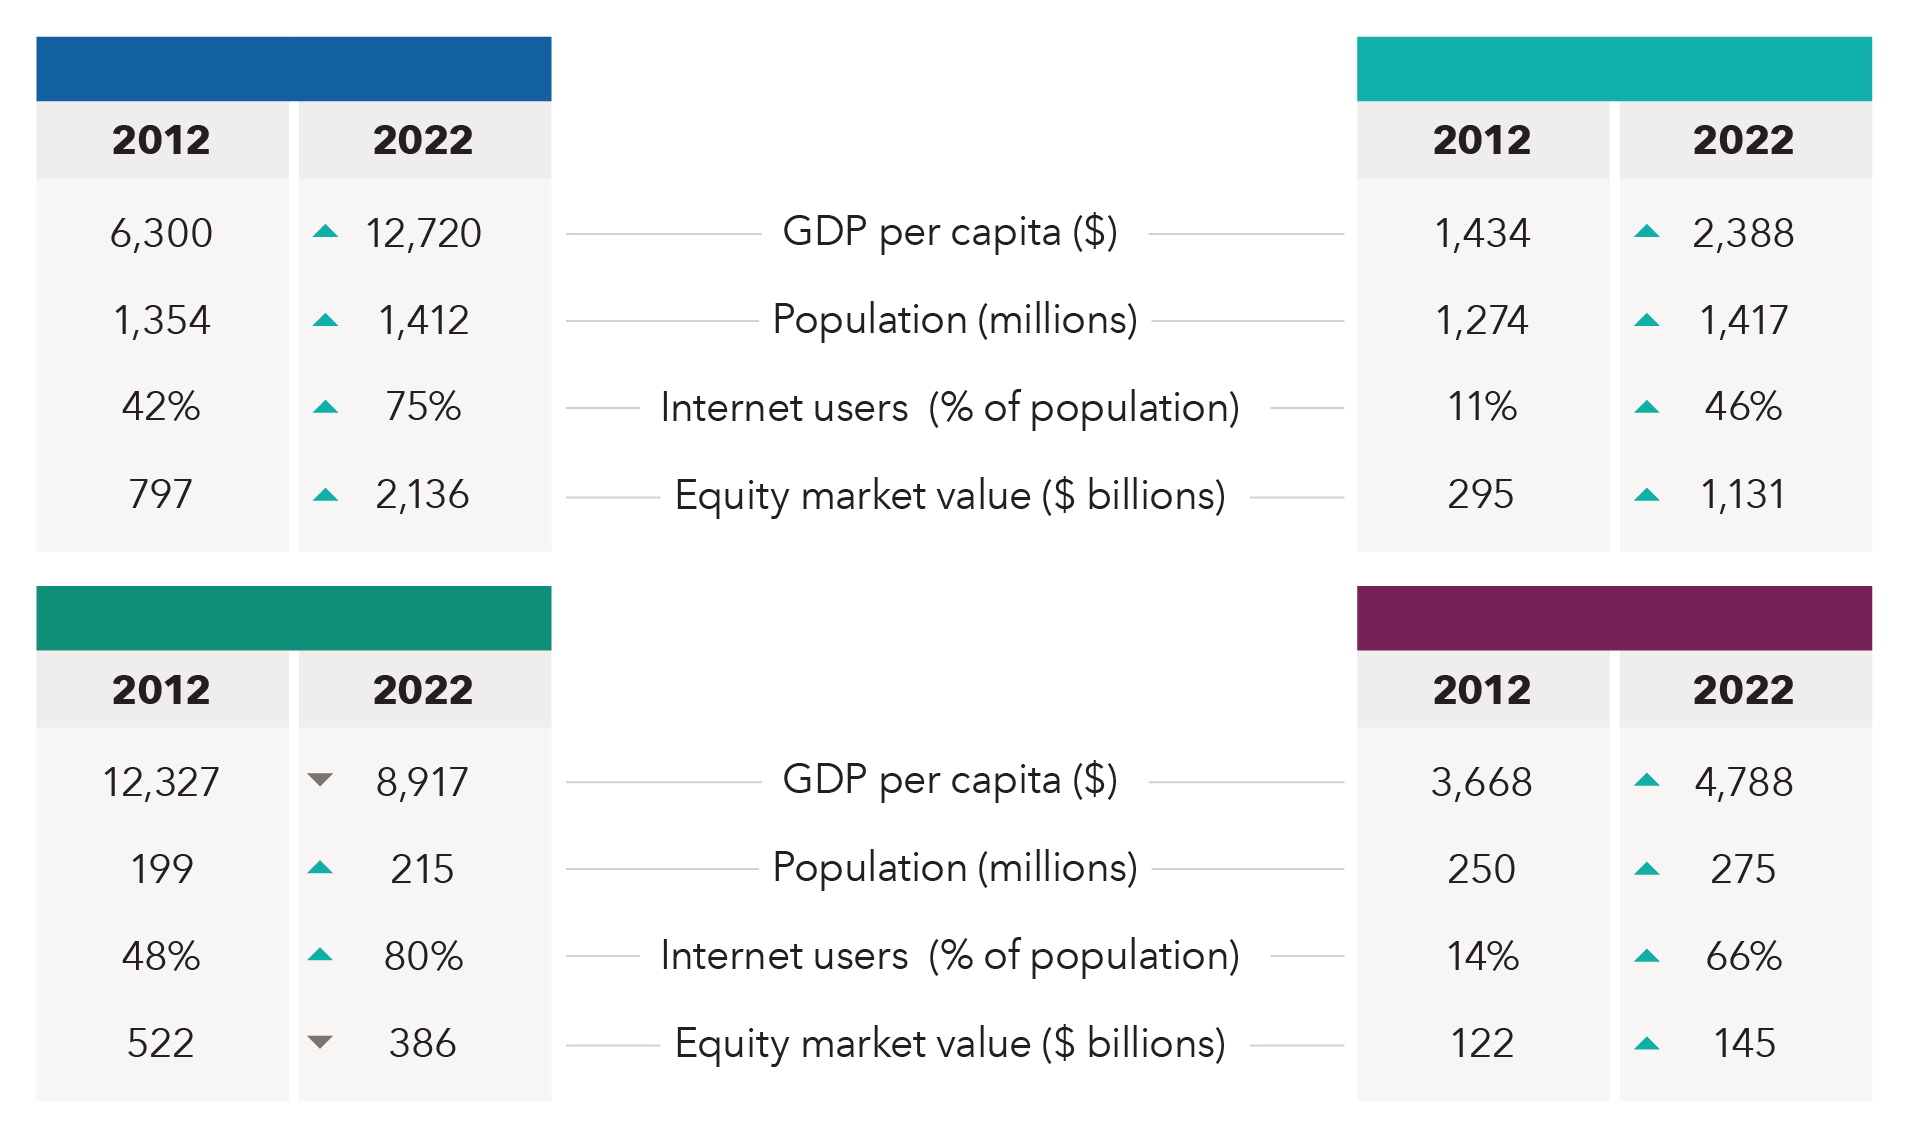
Sources: MSCI, RIMES, World Bank, World Development Indicators. Internet users for India as of 2021. Equity market value represents the MSCI index for each country.
3. A weakening dollar should be supportive over the medium term
The U.S. dollar is overvalued against most major and EM currencies on several metrics, according to our currency analyst. In the near term, the dollar may maintain strength against several major currencies including the euro, the yen and the British pound, largely driven by interest rate differentials. In the medium term, our analyst and global bond portfolio managers expect the dollar to weaken, or at a minimum, move within a range of current levels.
In the emerging markets, central bank policy rates are higher than the U.S. in many countries. Even as a few central banks have started to cut interest rates as inflation starts to move lower, nominal rates still remain higher. Many EM countries also have current account surpluses while the U.S. and other major developed economies are running deficits. This should bode well for EM currencies in the medium term. We have started to see some EM currencies make advances against the dollar in the past 12 months, notably the Mexican peso and Brazilian real. This should be supportive of EM returns, purely from the currency translation effect in portfolios. But we do not expect it to be the major driver of our investment decisions.
Emerging markets have historically benefited from a weakening dollar
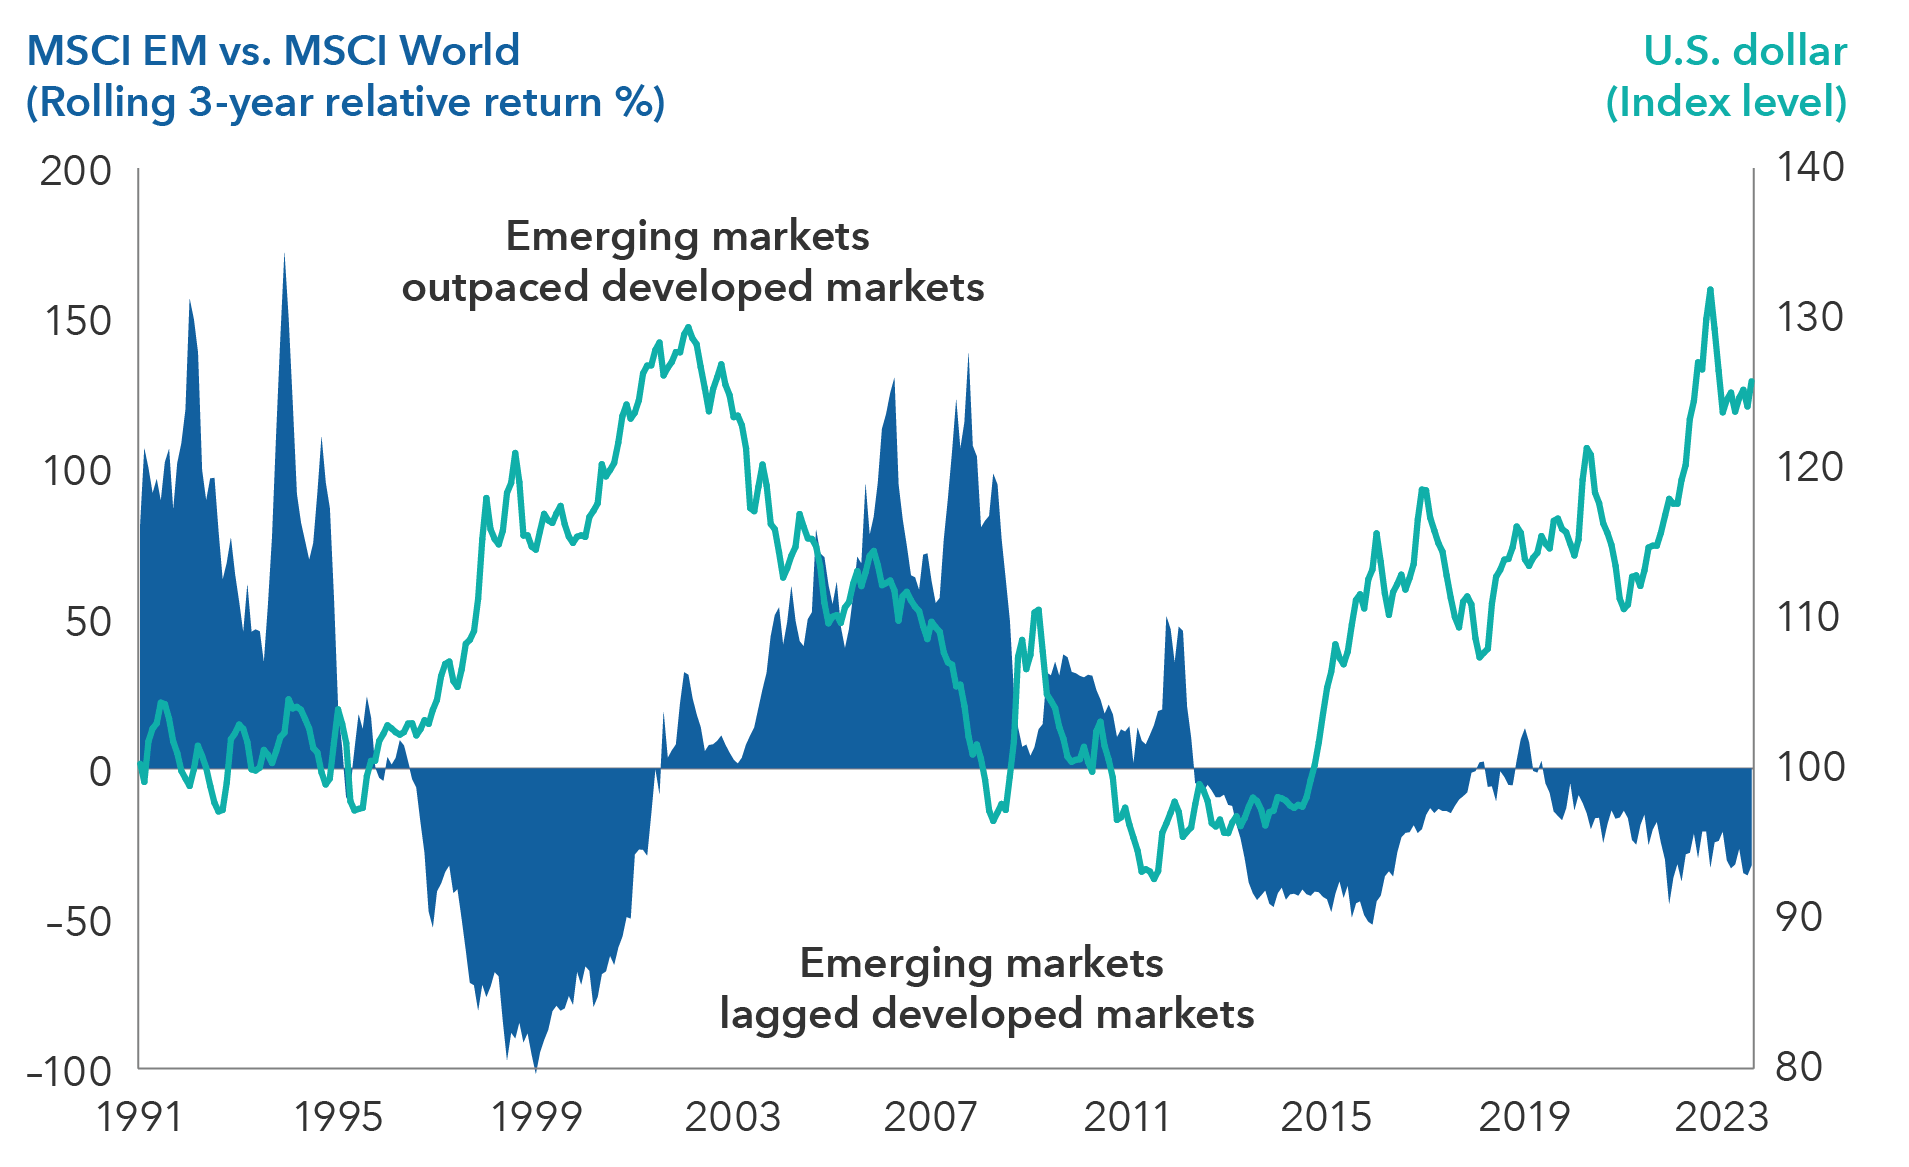
Sources: Capital Group, J.P. Morgan, MSCI, Refinitiv Datastream, RIMES. Relative returns data represent cumulative rolling monthly three-year total returns of the MSCI Emerging Markets Index versus the MSCI World Index in U.S. dollars, with positive values reflecting periods of outperformance by the MSCI Emerging Markets Index relative to the MSCI World Index, and negative values reflecting periods of outperformance by the MSCI World Index relative to the MSCI Emerging Markets Index. U.S. dollar is represented by the J.P. Morgan Real Broad Effective Exchange Rate Index. As of August 31, 2023.
China is the elephant in the room
China’s rise as a major manufacturing powerhouse and its property boom drove global commodities demand and powered EM from 2000 to 2010. China became the dominant constituent in the MSCI Emerging Markets (EM) Index, making up 43% of the index’s weight at its peak. That figure has declined to 29% as of September 30, 2023, as an economic slowdown and government regulation of several areas of the economy took its toll on China’s stock market.
China has matured and its $18 trillion economy is likely to grow at a slower rate. The government has taken a piecemeal approach to fiscal stimulus and will have to address how to reform and resurrect a highly indebted property sector. More importantly, having built out world-class infrastructure that has set up the economy for the modern age, the next phase of China’s economy will have to be powered both by the consumer and by moving further up the value chain in manufacturing and technology. In areas such as robotics and electric vehicle battery technology, China is already showing its prowess as a high-end manufacturer.
However, consumer confidence was battered by strict COVID lockdowns and the woes of the property sector and will need both time and government efforts to be restored. Nevertheless, we remain optimistic that this will happen over time. There are many areas of China’s economy where domestic consumption will be the key driver of growth. These include pharmaceutical treatments, autos, video gaming, e-commerce and financial products. Companies in these areas range from small to large and a few have emerged as multinationals.
Auto and battery manufacturer BYD and carmaker Geely are good examples. Both began as domestic manufacturers. By focusing on newer technologies of battery development and efficient manufacturing of electric vehicles, they have joined the ranks of the largest auto manufacturers worldwide. China is on course to surpass Japan to become the world’s largest exporter of automobiles, a feat that was unimaginable a decade ago and a reminder of how quickly the country can gain market share in an industry.
China’s emergence as a leader in electric vehicles challenges the dominance of German carmakers that have enjoyed a large market share in China and other EMs. This might contribute to ongoing geopolitical tensions and could result in tariffs and other restrictive measures.
Greater competition is expected to characterize many industries over the next decade, be it electric vehicles (EVs), industrial automation tools or semiconductors. But with talented entrepreneurs, China and its companies are likely to be in the mix by either emerging as global leaders, dominating their own domestic market or providing components along the supply chain.
China’s weight in the EM benchmark peaked in late 2020
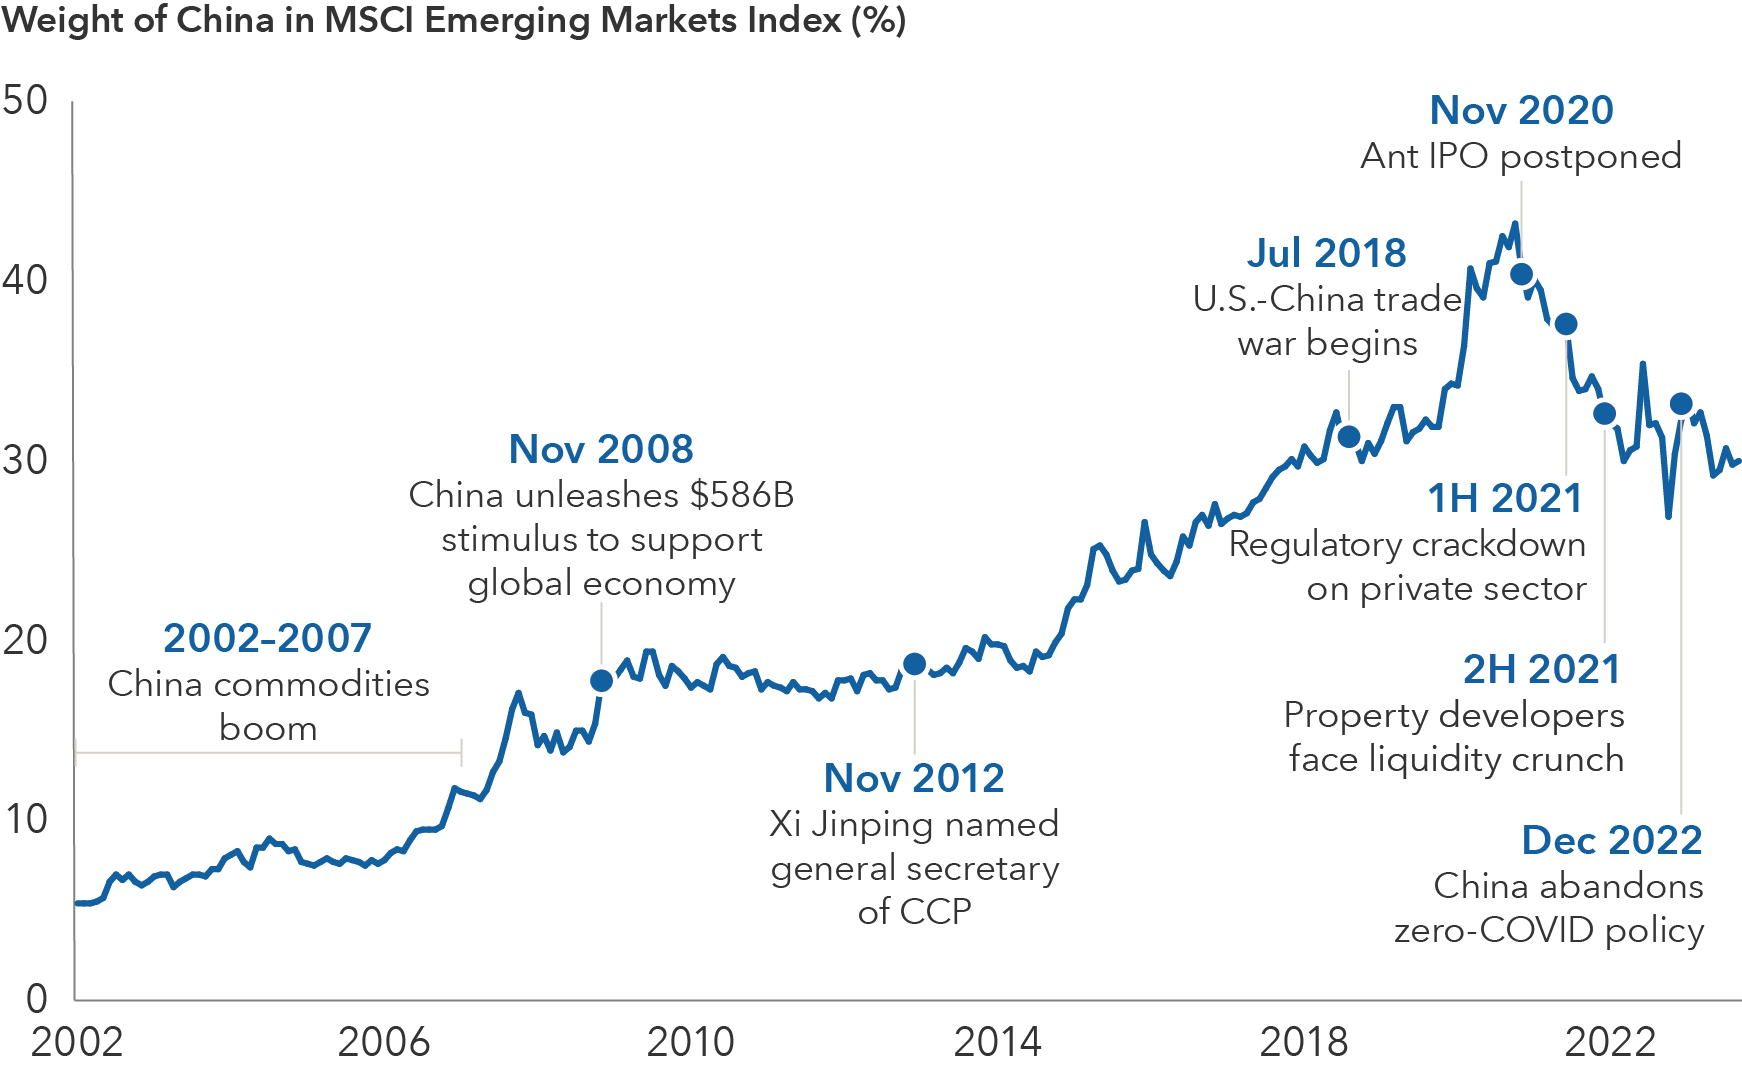
Sources: MSCI, RIMES. Postponement of Ant IPO contributed to selloff in Chinese equities. Data reflects January 31, 2002, to September 30, 2023.
Is China investable?
Often, we are asked, Is China investable? Our answer is not a binary yes or no. The reality is that China is an integral part of the global economy, especially given the large volume of trade and cross-border investment between Europe, Asia and the emerging markets. Do these regions want to reduce dependence on China as the growth engine of many industries? Yes. Can Europe, the U.S., Japan, India or other emerging markets completely disentangle from China’s economy? No.
Over the last few years, investors have swung from wanting to maximize their China exposure to having very few investments. The sharp selloff in Chinese equities since 2021 has weighed on the EM benchmark, leaving investors vulnerable to volatility, especially those who had exposure to China through a passive index vehicle, which typically seeks to track the weight of a particular benchmark.
Therefore, it is incumbent for asset managers and other investors to investigate firsthand and calibrate which areas, industries and companies are best positioned to benefit from these secular shifts and trends. We think this represents a good opportunity for active managers.
Geopolitical tensions can benefit emerging markets
The reconstruction of supply chains in many industries may benefit the developing world and help drive new sources of growth for a broader set of countries.
For instance, rather than aligning with one economic superpower, countries like Indonesia, India and Mexico are tapping into funding and investment from both leading Western countries and China. Furthermore, in seeking to diversify their supply chains, multinationals are also setting up manufacturing facilities across different geographies. Chinese companies are also diversifying abroad, some of them setting up final assembly for export to the U.S. in countries like Mexico.
A rise in foreign direct investment (FDI) can have positive effects on local economies. When a multinational builds a manufacturing plant, it often draws in investment from other companies in the supplier ecosystem who also establish a physical presence in that particular region of the world. And FDI investments have tended to be sticky compared to portfolio flows. In addition to being a longer term capital investment, FDI flows typically have a multiplier effect on economies, generating employment that in turn stimulates consumption.
Supply chain shifts broaden the investment landscape
The diversification of global supply chains should benefit several different markets.
Indonesia is making a concerted push to be a major nickel processor and an integral part of the supply chain for electric vehicle batteries, leveraging its position as the world’s leading supplier of nickel. In 2020, the country’s president banned exports of unprocessed nickel ore as part of a broader plan for the country to transition from being an exporter of raw materials to a value-added metals processor.
Relative to its boom-bust history driven by commodity cycles, success here could be transformational for the economy. Capturing a greater share of the entire supply chain, from smelting nickel to battery and car production, could change the country’s economic profile.
Indonesia has lured foreign companies to invest. China’s state-owned enterprises have spent billions of dollars to help finance and build nickel refinery plants in the country. Meanwhile, multinationals from South Korean auto company Hyundai, German chemical maker BASF and U.S. automaker Ford have all inked agreements to be involved in nickel processing.
Mexico recently replaced China as the U.S.’s largest trading partner. With a strong foundation in automobile and small-electronics manufacturing, investment today is broadening to medical devices, more complex electronics, furniture and general industrial goods.
Foreign direct investment has been rising. Some of the largest investments have come from automakers Tesla and BMW and electronic component makers Bosch and Continental. Another large investor is Japan-based Daikin, which is expanding its manufacturing footprint for energy-efficient air conditioners.
On our recent trips to Mexico, the scale of new manufacturing and distribution facilities under construction reminded us of China in the early 2000s. There’s also been an influx of Chinese manufacturers into the northern Mexico states, which are being used for final assembly for electronics products shipped to the U.S. Chinese companies have accounted for roughly 40% of leasing activity for manufacturing facilities in the past two years, local real estate sources have told us. Altogether, China’s direct investment in Mexico for computer equipment manufacturing totaled $282 million in 2021–2022, according to the Federal Reserve Bank of Dallas.
Asia is well positioned for the rewiring of global supply chains
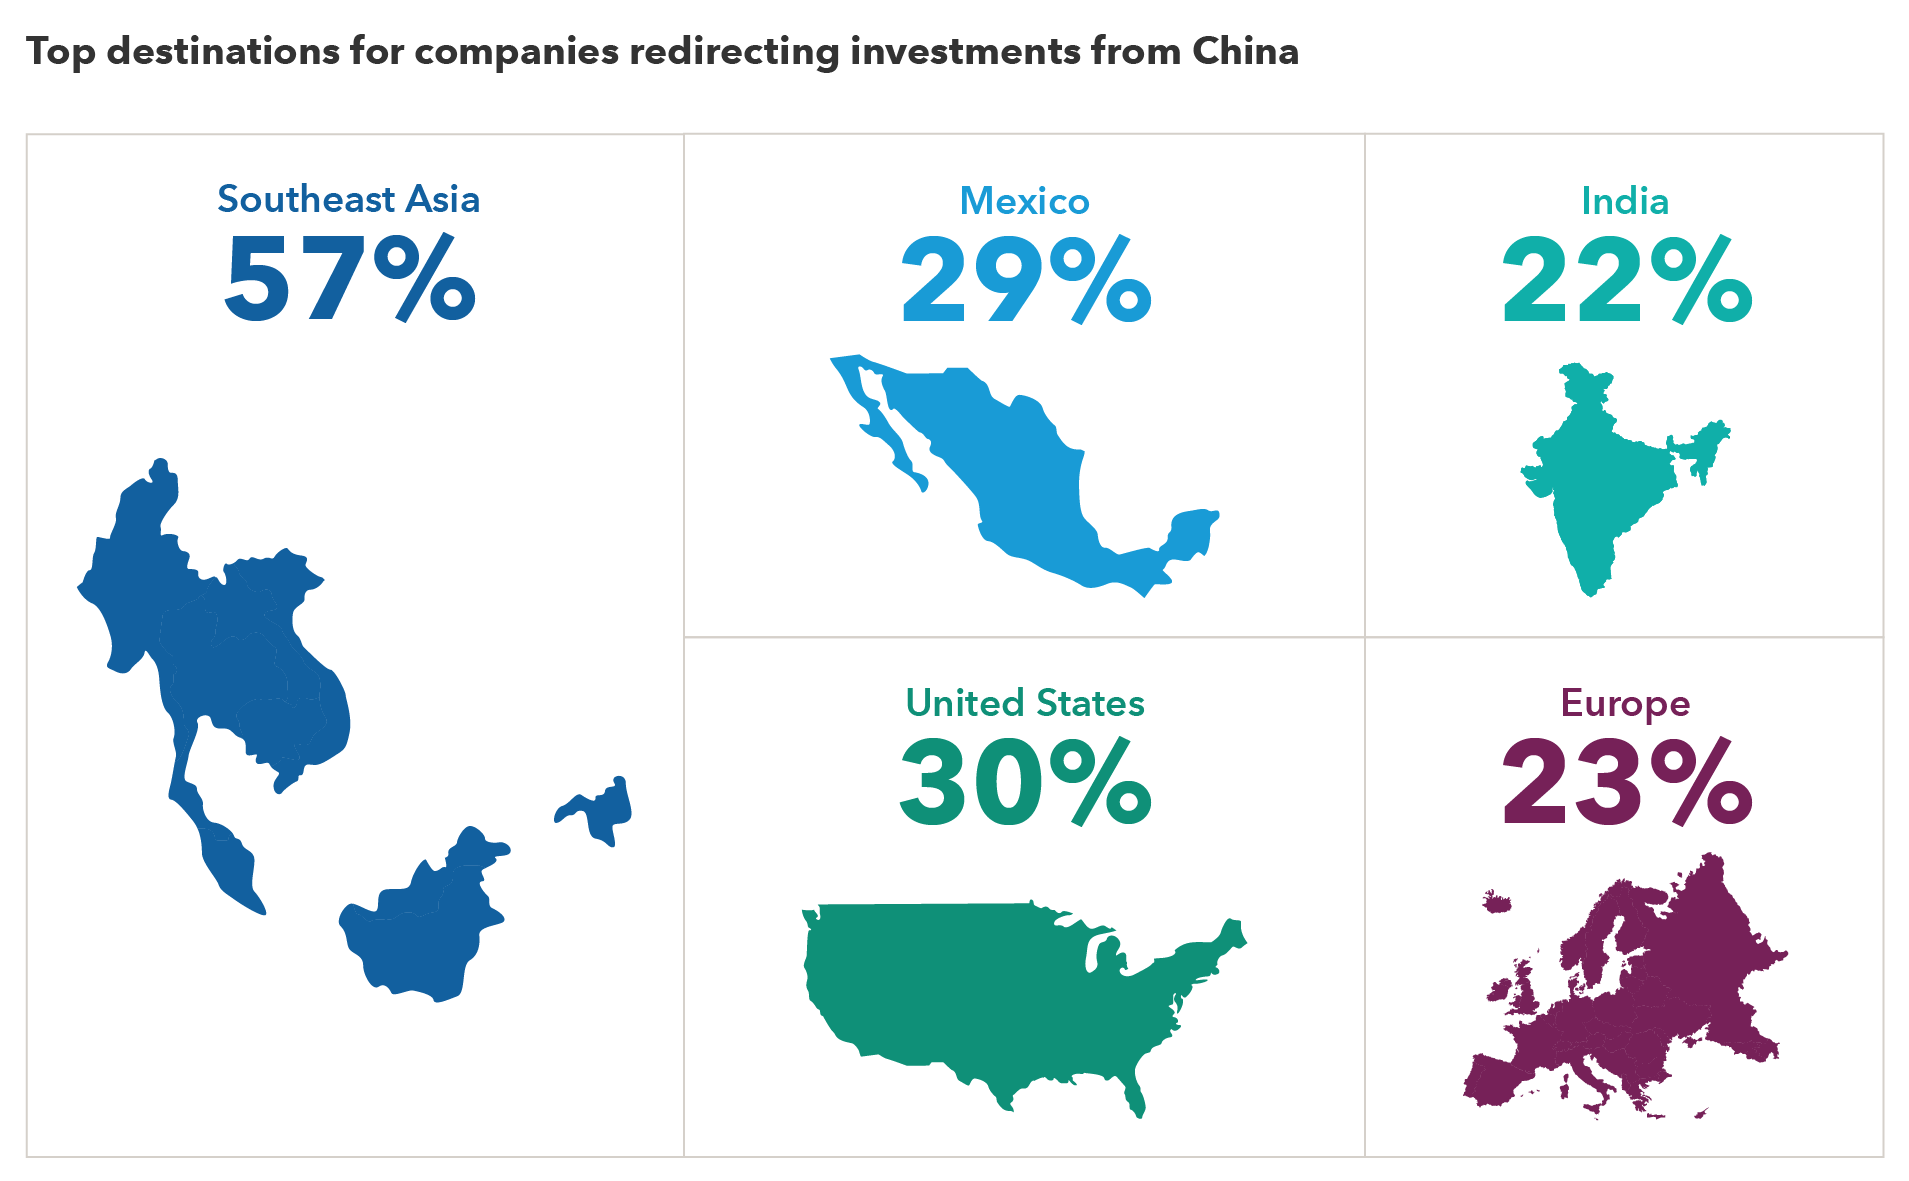
Source: AmCham Shanghai 2023 China Business Report, published 9/19/23. Based on a survey of 325 foreign companies doing business in China. Of those companies, 40% said they were redirecting investments from China to other locations, including Southeast Asia, Mexico, India and the United States, among others. Survey respondents could provide multiple responses, so total does not add up to 100%.
India has been expanding its manufacturing capacity for mobile phones, home appliances, computers and telecommunications equipment. The government has been aggressive in courting Japanese, Taiwanese and U.S. companies to invest in new capacity, including Apple, Foxconn, Daikin and Mitsubishi Electric.
The playbook for the Indian government is twofold: ramp up capacity to serve the domestic population and over time become a larger player in export markets. It also wants to develop a supply chain ecosystem, as a wide array of product components are imported.
India, like China early in its development, has been investing in the building of ports, roads, housing and industrial warehouses. This is preceding the manufacturing transition and could be additive to the economy and help sustain economic growth.
The energy transition could be another growth tailwind. Since the last mining supercycle ended in 2011 with overleveraged balance sheets and excess capacity, mining companies have become more financially disciplined, focusing on value over volume. They also spent more cash flow on distributions to shareholders over increasing capacity. Now, with the global push to build energy-efficient vehicles, power grids and buildings, there is growing demand to secure supplies of copper, nickel, iron ore and lithium. We anticipate this will drive major investments into new mining projects in parts of Africa, South America and Asia.
A dividend culture prevails in many markets
A culture of dividends has prevailed in many emerging markets, as historically many companies were part family-owned and depended on the payouts. And while capital markets have expanded and family ownership has declined, the culture of dividends has persisted. Corporate managements have shown an inclination to support dividend payments through different economic and market cycles and worked it into their capital allocation and planning.
The number of companies in the MSCI EM Index that offered a dividend yield higher than 3% totaled 468 as of September 30, 2023, compared to 349 for international markets (MSCI EAFE) and 147 in the U.S. (S&P 500).
As would be expected, dividend payouts tend to be higher in traditional industries such as telecoms, banks and industrials and less so in the newer technology companies. This allows us to build rounded portfolios of pro-growth cyclical companies and dividend-oriented corporations.
Emerging markets have evolved and so have the opportunities
We’ve also been digging deeper into developing countries that are not the traditional index heavyweights of China, India and Brazil. Our EM-related funds have made incremental investments in Mexico, Indonesia, South Africa and Saudi Arabia over the past year. And perhaps over time, these countries may be larger in our funds than they have been historically.
Twenty-two years ago, the phrase “BRICs” was coined to describe the potential for the emerging markets of Brazil, Russia, India and China. Not all have lived up to those heady expectations, and EM equities have lagged developed markets for the past decade.
We do think durable trends — reshoring of supply chains, powerful shifts in demographics, infrastructure growth, the energy transition, the emergence of sticky and large domestic brands — could add more depth to EM equity markets.
Furthermore, government balance sheets are stronger, inflation is coming under control and a decade-long bull market for the U.S. dollar may be abating. On top of that, valuations for nearly all sectors in the MSCI EM Index are near 10-year lows, making for an attractive asset class over the medium- to long term.
Of public pensions with exposure to emerging markets, 35% expected to maintain or increase exposure to emerging market debt and 78% expected to maintain or increase exposure to emerging market equities.5 As long-term investors, the current opportunity in EM has the potential to increase expected return and improve diversification in pension portfolios.
Plan sponsors can access emerging markets through investment strategies that are more narrowly focused on emerging markets or through mandates that have a broader geographic purview encompassing emerging markets. In such a deep and challenging market, active management can be particularly helpful in navigating geopolitical issues and more idiosyncratic risks, helping investors to benefit from the potential tailwinds and strategic opportunities that this market has to offer.
Don't miss our latest insights.
Our latest insights
-
Defined Contribution
-
Defined Benefit
-
Liability-Driven Investing
-
Defined Benefit
-
Regulation & Legislation
1 Source: Milliman 100 Public Pension Funding Index. As of September 30, 2023.
2 Source: Cerulli Associates, The Cerulli Report: North American Institutional Markets 2022. As of 2Q 2022.
3 As of October 31, 2023.
4 Index proxies for these capital market assumptions are the MSCI Emerging Markets Index for emerging markets equity, and the J.P. Morgan Emerging Market Bond Index (EMBI) Global Diversified for emerging markets debt denominated in U.S. dollars.
5 Source: Cerulli Associates, The Cerulli Report: North American Institutional Markets 2022. Reflects intentions over the following 24 months, as of 3Q 2022.
Capital market assumptions included in this analysis represent the views of a small group of investment professionals based on their individual research and are approved by the Capital Market Assumptions Oversight Committee. They should not be interpreted as the view of Capital Group as a whole. As Capital Group employs The Capital System, the views of other individual analysts and portfolio managers may differ from those presented here. They are provided for informational purposes only and are not intended to provide any assurance or promise of actual returns. They reflect long-term projections of asset class returns and are based on the respective benchmark indexes or other proxies and therefore do not include any outperformance gain or loss that may result from active portfolio management. Note that the actual results will be affected by any adjustments to the mix of asset classes. All market forecasts are subject to a wide margin of error.
Investing in developing markets may be subject to additional risks, such as significant currency and price fluctuations, political instability, differing securities regulations and periods of illiquidity, which are detailed in the fund's prospectus. Investments in developing markets have been more volatile than investments in developed markets, reflecting the greater uncertainties of investing in less established economies. Individuals investing in developing markets should have a long-term perspective and be able to tolerate potentially sharp declines in the value of their investments.
All indexes are unmanaged, and their results include reinvested distribution but do not reflect the effect of sales charges, commissions, account fees, expenses, or U.S. federal income taxes. It is not possible to invest in an index.
MSCI All Country World Index (ACWI) is designed to measure results of more than 40 developed and emerging equity markets.
The MSCI China Index captures large and mid-cap representation across China A shares, H shares, B shares, Red chips, P chips and foreign listings (e.g. ADRs). With 765 constituents as of November 30, 2023, the index covers about 85% of this China equity universe.
The MSCI Emerging Markets Index is a free float-adjusted market-capitalization-weighted index that is designed to measure equity market results in the global emerging markets, consisting of more than 20 emerging market country indexes.
The MSCI Brazil Index is designed to measure the performance of the large and mid-cap segments of the Brazilian market. With 47 constituents, the index covers about 85% of the Brazilian equity universe.
The MSCI India Index is designed to measure the performance of the large and mid-cap segments of the Indian market. With 114 constituents, the index covers approximately 85% of the Indian equity universe.
The MSCI Mexico Index is designed to measure the performance of the large and mid-cap segments of the Mexican market. With 23 constituents, the index covers approximately 85% of the free-float-adjusted market capitalization in Mexico.
The MSCI Indonesia Index is designed to measure the performance of the large and mid-cap segments of the Indonesian market.
MSCI EAFE® (Europe, Australasia, Far East) Index is designed to measure developed equity market results, excluding the United States and Canada.
The MSCI World Index captures large and mid-cap representation across 23 developed-market countries. With 1,510 constituents, the index covers approximately 85% of the free float-adjusted market capitalization in each country.
J.P. Morgan Emerging Markets Bond Index (EMBI) Global Diversified and related country-specific indexes track total returns for U.S. dollar-denominated debt instruments issued by emerging market sovereign and quasi-sovereign entities: Brady bonds, loans, eurobonds.
The Consumer Price Index (CPI), reported by the U.S. Bureau of Labor Statistics, measures the change in prices paid by consumers for goods and services.
The J.P. Morgan Real Broad Effective Exchange Rate Index measures the inflation-adjusted value of the U.S. dollar against a group of developed and emerging market currencies.
S&P 500 Index is a market-capitalization-weighted index based on the results of 500 widely held common stocks. This index is unmanaged, and its results include reinvested dividends and/or distributions but do not reflect the effect of sales charges, commissions, account fees, expenses or U.S. federal income taxes.
The S&P 500 (“Index”) is a product of S&P Dow Jones Indices LLC and/or its affiliates and has been licensed for use by Capital Group. Copyright © 2023 S&P Dow Jones Indices LLC, a division of S&P Global, and/or its affiliates. All rights reserved. Redistribution or reproduction in whole or in part are prohibited without written permission of S&P Dow Jones Indices LLC.
BLOOMBERG® is a trademark and service mark of Bloomberg Finance L.P. and its affiliates (collectively “Bloomberg”). Bloomberg or Bloomberg’s licensors own all proprietary rights in the Bloomberg Indices. Neither Bloomberg nor Bloomberg’s licensors approves or endorses this material or guarantees the accuracy or completeness of any information herein, or makes any warranty, express or implied, as to the results to be obtained therefrom and, to the maximum extent allowed by law, neither shall have any liability or responsibility for injury or damages arising in connection therewith.
MSCI has not approved, reviewed or produced this report, makes no express or implied warranties or representations and is not liable whatsoever for any data in the report. You may not redistribute the MSCI data or use it as a basis for other indices or investment products.
This report, and any product, index or fund referred to herein, is not sponsored, endorsed or promoted in any way by J.P. Morgan or any of its affiliates who provide no warranties whatsoever, express or implied, and shall have no liability to any prospective investor, in connection with this report.


