Getting started

Decoding fund details

Here’s an example fund page to help guide you through some important information when researching the details of a fund.

The data below is intended as an example. Please see the complete American Mutual Fund® fund details page.

Quick scan

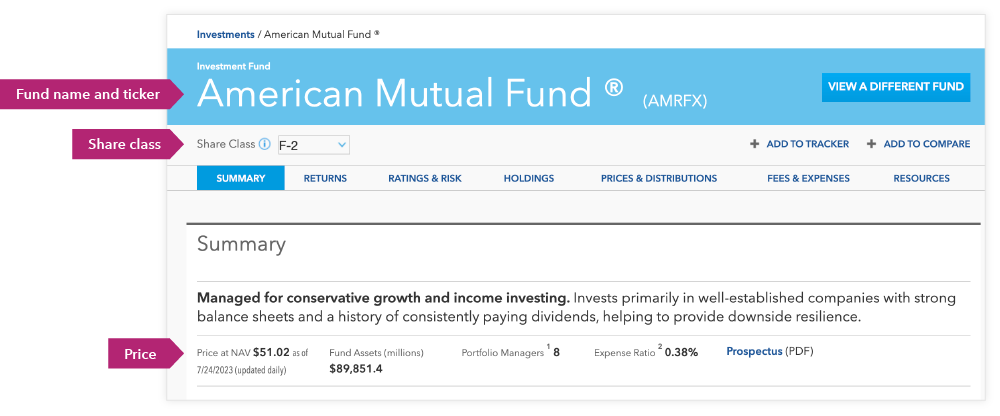
At the top is where you’ll find the big-picture information for a fund, including a description of its overall strategy.

Fund name and ticker

The ticker symbol (the letters after the name) is the most accurate way to search for a fund. It’s unique to the fund and share class and is used by third parties, like Morningstar® and brokerage firms. It’s also useful to refer to when you’re comparing two funds with similar names.


Share class

Mutual funds often offer different types of shares, or classes, to investors. A fund’s share class determines what kind of fees and expenses you will be charged for the fund. Which share class is right for you will depend on your particular situation. All share classes of a fund invest in the same holdings and have the same investment objectives.


Price

Net asset value (NAV) is the value, or price, of each mutual fund share. Mutual funds price their shares once a day, after the market closes. The price doesn’t change throughout the day. You can also invest in fractions of a share.


Check this fund’s results*

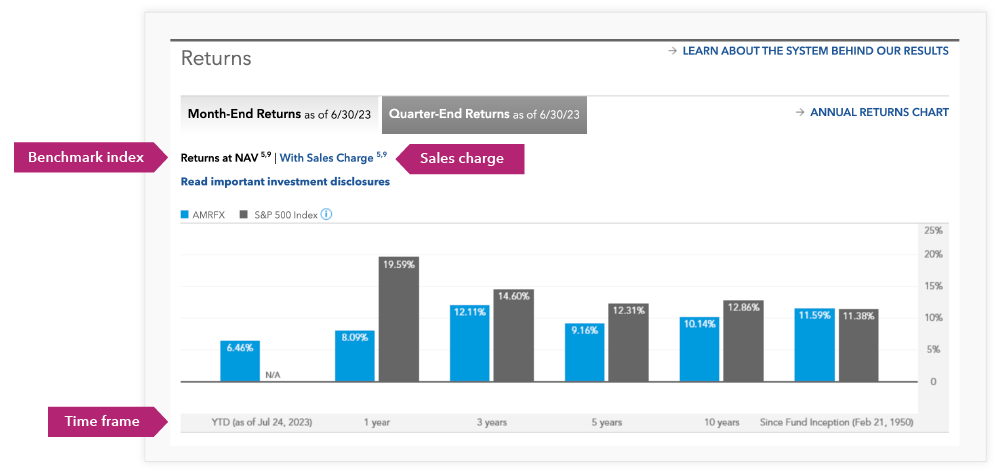
See how this fund has done over the years. Keep in mind that many mutual funds are designed for a long-term investing strategy, so the 10-year mark may be a good starting point for your evaluation.


Look for “Returns at NAV” to see the average returns of the fund over time compared to the fund’s benchmark.

What does this compare against?

We provide a benchmark index for comparison to reflect the fund’s investment universe. Select “Returns at NAV” to see this comparison.

NAV is equal to a fund’s total assets less its liabilities. It is calculated at the end of each trading day based on the closing market prices of the fund’s holdings. It does not include the cost of any sales charges.


What is a sales charge?

A “load” or sales charge principally refers to a sales commission that is paid to a financial professional, broker or other intermediary who helps clients make decisions about which mutual fund to purchase. A front-end load means the fee is charged upon purchase of the mutual fund.

Returns with sales charge are your results after calculating the effect of paying the full sales charge. This impact diminishes over longer time periods.

Why does time matter?

The shorter the time frame you consider, the less you can determine upward or downward trends. Generally, any time frame less than five years is not long enough to get a picture of a fund’s long-term results.


*Illustrative purposes only

Understanding fees

All mutual funds have fees, which go toward the operation of that fund. However, some fees may be less than others. For example, international funds often have higher fees than domestic funds because it can cost more to research and invest in companies outside the U.S.


To determine what you would actually pay yearly, multiply the expense ratio by the value of your investment. For example, if you invest $1,000 in a fund with a 0.69% expense ratio, you will pay $6.90.

Expense ratio¹

This shows the total of all fund fees. It’s useful to compare a fund’s expense ratio to the Lipper average — which shows the average for the fund category — to see if it’s more or less expensive than its peers.

Composition of a fund

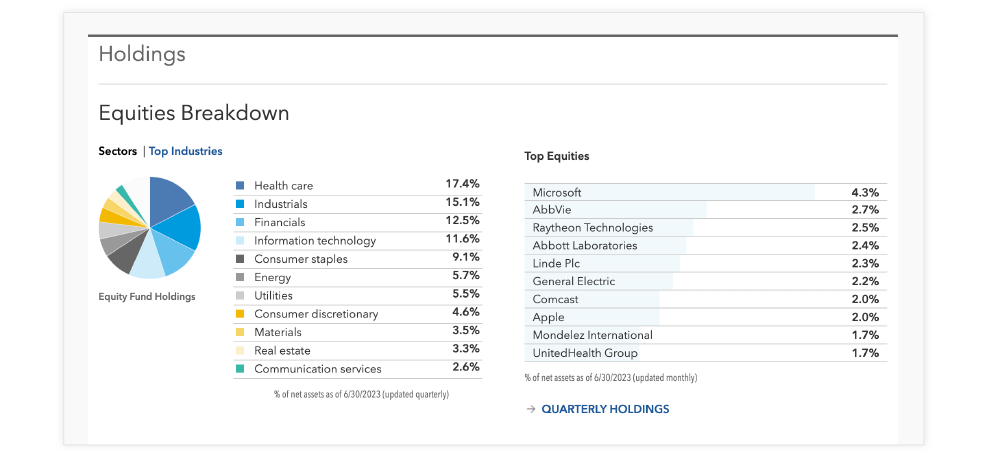
Depending on the mutual fund, it may invest in a number of different types of stocks, bonds or other securities. The composition of these differs from fund to fund in order to align with that fund’s strategy.


You can take a look at a fund’s holdings to better understand the different sectors, industries and companies in which the fund is invested.

Find the right funds for you

Now that you know what to look for, let’s explore funds that can help you pursue your goals.

EXPLORE FUNDS

S&P 500 Index is a market capitalization-weighted index based on the results of approximately 500 widely held common stocks. This index is unmanaged, and its results include reinvested dividends and/or distributions but do not reflect the effect of sales charges, commissions, account fees, expenses or U.S. federal income taxes.

Investments are not FDIC-insured, nor are they deposits of or guaranteed by a bank or any other entity, so they may lose value.
Investors should carefully consider investment objectives, risks, charges and expenses. This and other important information is contained in the fund prospectuses and summary prospectuses, which can be obtained from a financial professional and should be read carefully before investing.
There may have been periods when the results lagged the index(es) and/or average(s). The indexes are unmanaged and, therefore, have no expenses. Investors cannot invest directly in an index.
Each S&P Index ("Index") shown is a product of S&P Dow Jones Indices LLC and/or its affiliates and has been licensed for use by Capital Group. Copyright © 2024 S&P Dow Jones Indices LLC, a division of S&P Global, and/or its affiliates. All rights reserved. Redistribution or reproduction in whole or in part is prohibited without written permission of S&P Dow Jones Indices LLC.
All Capital Group trademarks mentioned are owned by The Capital Group Companies, Inc., an affiliated company or fund. All other company and product names mentioned are the property of their respective companies.
When applicable, results reflect fee waivers and/or expense reimbursements, without which they would have been lower and net expenses higher. Please refer to capitalgroup.com for more information. Read details about how waivers and/or reimbursements affect the results for each fund. View results and yields without fee waiver and/or expense reimbursement.
  1. Expense ratios are as of each fund's prospectus available at the time of publication.
Use of this website is intended for U.S. residents only.
American Funds Distributors, Inc.
This content, developed by Capital Group, home of American Funds, should not be used as a primary basis for investment decisions and is not intended to serve as impartial investment or fiduciary advice.
© 2024 Morningstar, Inc. All Rights Reserved. Some of the information contained herein: (1) is proprietary to Morningstar and/or its content providers; (2) may not be copied or distributed; and (3) is not warranted to be accurate, complete or timely. Neither Morningstar, its content providers nor Capital Group are responsible for any damages or losses arising from any use of this information. Past performance is no guarantee of future results. Information is calculated by Morningstar. Due to differing calculation methods, the figures shown here may differ from those calculated by Capital Group.