EuroPacific Growth Fund®

DEFINED CONTRIBUTION FOCUS FUNDS
 

A core international fund with broad access to developed and emerging markets

Better results

The value of a hypothetical lifetime investment in the fund would have been more than double that of the historical and primary indexes as well as the EUPAC Historical Morningstar Peer Group Average.* The fund outpaced its peers in 99% (239 out of 241) of rolling monthly 10-year periods over the past 30 years ended December 31, 2022.

A 38-year legacy of success

Bar chart shows the hypothetical lifetime value of $10,000 investments: EuroPacific Growth Fund, $404,687; EUPAC Historical Benchmarks Index (reference footnote †), $172,282; MSCI All Country World ex USA Index (reference footnote ‡), $191,731; and Morningstar Foreign Large Growth (reference footnote §), $144,607.
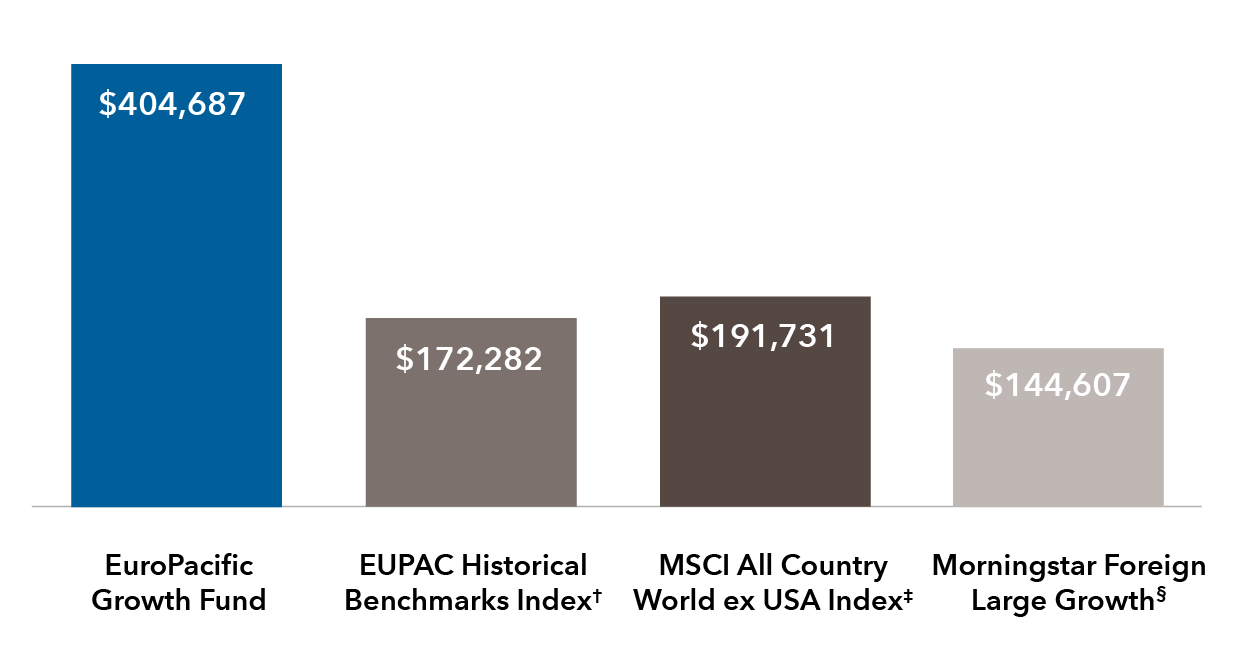
Value of hypothetical $10,000 investments since the fund began on April 16, 1984, through December 31, 2022.

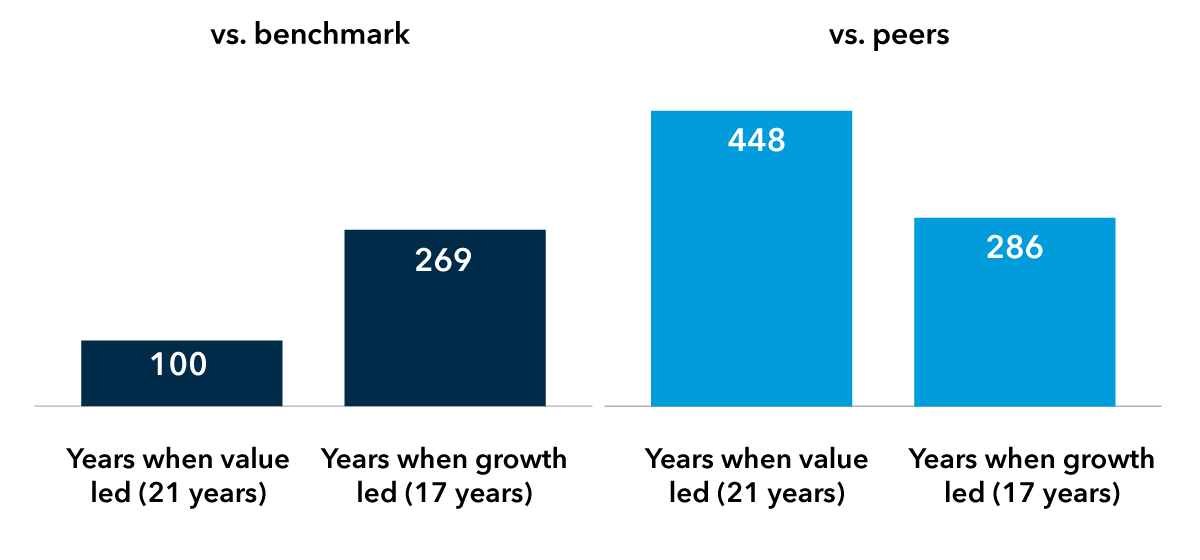
A diversified approach

The fund's broad mandate and opportunistic approach led to strong relative results in both growth- and value-led markets. 

Average calendar-year excess return versus benchmark and peers, in basis points (1985-2022)*†**
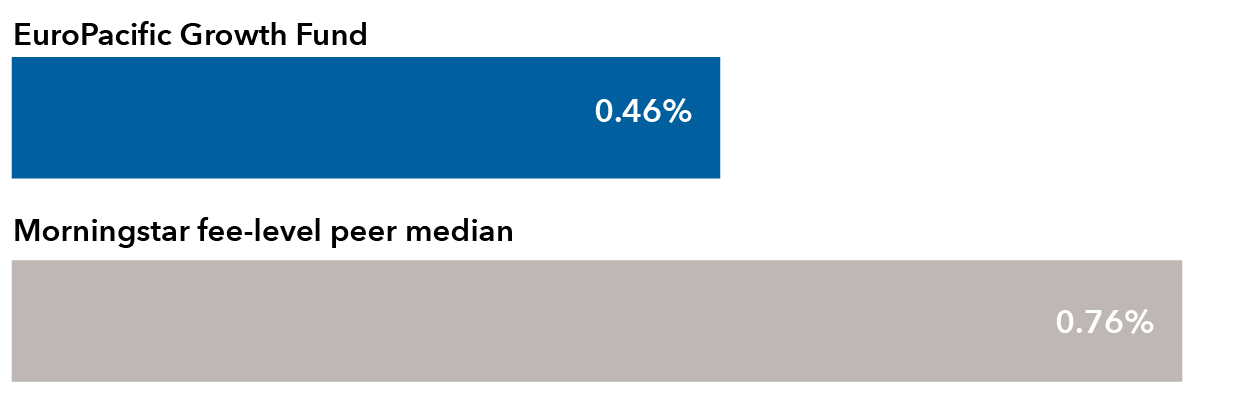
 

Bar charts show EuroPacific Growth Fund’s average excess return over its benchmark was 100 bps in the 21 calendar years when value led and 269 bps in the 17 years when growth led. The fund's average excess return over its peer average was 448 bps in the 21 years when value led and 286 bps in the 17 years when growth led.

Low fees

Overseas investing doesn’t have to be costly. The fund’s expense ratio was significantly lower than its Foreign Large Cap Retirement, Large peer median.††1

Expense ratio††1

Bar chart compares expense ratios (reference footnotes †† and 1): EuroPacific Growth Fund, 0.46%; Morningstar fee-level peer group median, 0.76%.
RECOGNITION
morningstar logo

Morningstar Medalist RatingTM

of Gold‡‡

The “most used” defined

 contribution plan international/

global equity fund§§

Want to learn more about the fund?

We're here to help

Our dedicated retirement plan sales support can help you win and retain plans.

*The EuroPacific Growth Fund Historical Morningstar Peer Group Average reflects the Foreign Large Blend Category from the fund’s inception to September 2014 and Foreign Large Growth Category thereafter.


EuroPacific Growth Fund Historical Benchmarks Index returns reflect the results of the MSCI EAFE® Index through 03/31/2007 and the MSCI All Country World ex USA Index, the fund’s current primary benchmark, thereafter. MSCI EAFE® (Europe, Australasia, Far East) Index is a free float-adjusted market capitalization weighted index that is designed to measure developed equity market results, excluding the United States and Canada. MSCI All Country World ex USA Index is a free float-adjusted market capitalization weighted index that is designed to measure equity market results in the global developed and emerging markets, excluding the United States. The index consists of more than 40 developed and emerging market country indexes. Results reflect dividends net of withholding taxes. These indexes are unmanaged, and their results include reinvested dividends and/or distributions but do not reflect the effect of sales charges, commissions, account fees, expenses or U.S. federal income taxes.


MSCI All Country World ex USA Index is a free float-adjusted market capitalization weighted index that is designed to measure equity market results in the global developed and emerging markets, excluding the United States. The index consists of more than 40 developed and emerging market country indexes. Results reflect dividends gross of withholding taxes through December 31, 2000, and dividends net of withholding taxes thereafter. This index is unmanaged, and its results include reinvested dividends and/or distributions but do not reflect the effect of sales charges, commissions, account fees, expenses or U.S. federal income taxes.


§The Morningstar Foreign Large Growth category represents funds that seek capital appreciation by investing in large international stocks that are growth-oriented. Large-cap foreign stocks have market capitalizations greater than $5 billion. Growth is defined based on high price/ book and price/cash-flow ratios, relative to the MSCI EAFE Index.


**Source: Capital Group, based on data from Morningstar. Fund excess return is relative to the EUPAC Historical Benchmarks Index (MSCI All Country World Index ex USA, April 2007-present; MSCI EAFE Index, fund inception-March 2007) and EUPAC Historical Morningstar Peer Group Average (Foreign Large Blend from fund inception until September 2014; Foreign Large Growth thereafter). To ensure no survivorship bias, the returns were calculated on a daily basis to capture all funds in the average. Years when value led were those in which the MSCI EAFE Value Index’s cumulative return exceeded the MSCI EAFE Growth Index’s cumulative return. Years when growth led were those in which the MSCI EAFE Growth Index outpaced the MSCI EAFE Value Index. The EAFE Indexes were used for the value-growth comparisons to make the investment universe consistent for the entire time span.


††The fund’s Class R-6 expense ratio is as of the most recent prospectus available at the time of publication. The peer group expense ratio median was calculated based on funds in the following Morningstar Fee Level Group — Distribution category: Foreign Large Cap Retirement, Large, as of December 31, 2022.


‡‡As of July 17, 2023, based on Class R-6 shares.


§§Source: “Mutual funds most used by DC plans, by asset class 2022,” Pensions & Investments, November 2, 2022, based on assets as of June 30, 2022, International/global equity category.

Figures shown are past results and are not predictive of results in future periods. Current and future results may be lower or higher than those shown. Investing for short periods makes losses more likely. Prices and returns will vary, so investors may lose money. View mutual fund expense ratios and returns.
Investments are not FDIC-insured, nor are they deposits of or guaranteed by a bank or any other entity, so they may lose value.
Investors should carefully consider investment objectives, risks, charges and expenses. This and other important information is contained in the fund prospectuses and summary prospectuses, which can be obtained from a financial professional and should be read carefully before investing.
Investing outside the United States involves risks, such as currency fluctuations, periods of illiquidity and price volatility. These risks may be heightened in connection with investments in developing countries.
The Morningstar Medalist Rating™ is the summary expression of Morningstar's forward-looking analysis of investment strategies as offered via specific vehicles using a rating scale of Gold, Silver, Bronze, Neutral, and Negative. The Medalist Ratings indicate which investments Morningstar believes are likely to outperform a relevant index or peer group average on a risk-adjusted basis over time. Investment products are evaluated on three key pillars (People, Parent, and Process) which, when coupled with a fee assessment, forms the basis for Morningstar's conviction in those products' investment merits and determines the Medalist Rating they're assigned. Pillar ratings take the form of Low, Below Average, Average, Above Average, and High. Pillars may be evaluated via an analyst's qualitative assessment (either directly to a vehicle the analyst covers or indirectly when the pillar ratings of a covered vehicle are mapped to a related uncovered vehicle) or using algorithmic techniques. Vehicles are sorted by their expected performance into rating groups defined by their Morningstar Category and their active or passive status. When analysts directly cover a vehicle, they assign the three pillar ratings based on their qualitative assessment, subject to the oversight of the Analyst Rating Committee, and monitor and reevaluate them at least every 14 months. When the vehicles are covered either indirectly by analysts or by algorithm, the ratings are assigned monthly. For more detailed information about these ratings, including their methodology, please go to global.morningstar.com/managerdisclosures/. The Morningstar Medalist Ratings are not statements of fact, nor are they credit or risk ratings. The Morningstar Medalist Rating (i) should not be used as the sole basis in evaluating an investment product, (ii) involves unknown risks and uncertainties which may cause expectations not to occur or to differ significantly from what was expected, (iii) are not guaranteed to be based on complete or accurate assumptions or models when determined algorithmically, (iv) involve the risk that the return target will not be met due to such things as unforeseen changes in management, technology, economic development, interest rate development, operating and/or material costs, competitive pressure, supervisory law, exchange rate, tax rates, exchange rate changes, and/or changes in political and social conditions, and (v) should not be considered an offer or solicitation to buy or sell the investment product. A change in the fundamental factors underlying the Morningstar Medalist Rating can mean that the rating is subsequently no longer accurate.
Capital Group offers a range of share classes designed to meet the needs of retirement plan sponsors and participants. The different share classes incorporate varying levels of financial professional compensation and service provider payments. Because Class R-6 shares do not include any recordkeeping payments, expenses are lower and results are higher. Other share classes that include recordkeeping costs have higher expenses and lower results than Class R-6.
There may have been periods when the results lagged the index(es) and/or average(s). The indexes are unmanaged and, therefore, have no expenses. Investors cannot invest directly in an index.
MSCI has not approved, reviewed or produced this report, makes no express or implied warranties or representations and is not liable whatsoever for any data in the report. You may not redistribute the MSCI data or use it as a basis for other indices or investment products.
All Capital Group trademarks mentioned are owned by The Capital Group Companies, Inc., an affiliated company or fund. All other company and product names mentioned are the property of their respective companies.
Investment results assume all distributions are reinvested and reflect applicable fees and expenses.
When applicable, results reflect fee waivers and/or expense reimbursements, without which they would have been lower and net expenses higher. Please refer to capitalgroup.com for more information. Read details about how waivers and/or reimbursements affect the results for each fund. View results and yields without fee waiver and/or expense reimbursement.
Certain share classes were offered after the inception dates of some funds. Results for these shares prior to the dates of first sale are hypothetical based on the original share class results without a sales charge, adjusted for typical estimated expenses. 
  • Class R-6 shares were first offered on 5/1/2009.
Results for certain funds with an inception date after the share class inception also include hypothetical returns because those funds' shares sold after the funds' date of first offering. View dates of first sale and specific expense adjustment information.
  1. Expense ratios are as of each fund's prospectus available at the time of publication.
Use of this website is intended for U.S. residents only. Use of this website and materials is also subject to approval by your home office.
American Funds Distributors, Inc.
This content, developed by Capital Group, home of American Funds, should not be used as a primary basis for investment decisions and is not intended to serve as impartial investment or fiduciary advice.
© 2024 Morningstar, Inc. All Rights Reserved. Some of the information contained herein: (1) is proprietary to Morningstar and/or its content providers; (2) may not be copied or distributed; and (3) is not warranted to be accurate, complete or timely. Neither Morningstar, its content providers nor Capital Group are responsible for any damages or losses arising from any use of this information. Past performance is no guarantee of future results. Information is calculated by Morningstar. Due to differing calculation methods, the figures shown here may differ from those calculated by Capital Group.