The Bond Fund of America®

DEFINED CONTRIBUTION FOCUS FUNDS

True core for the DC menu

Rethink passive funds at the core

As the largest actively managed bond fund in the Morningstar Intermediate Core Bond category as of December 31, 2022, The Bond Fund of America has consistently produced strong returns compared to its passive peers.

Average annualized excess returns for the fund and passive peers (%)*

Chart shows average annual excess returns for the R-6 share class of The Bond Fund of America and its passive peers in the Morningstar Intermediate Core Bond category, net of fees, relative to the benchmark index, for periods ended December 31, 2022. Over three years, the fund delivered 163 basis points of excess return, while the peer group delivered an average negative 28 basis points. Over five years, the fund delivered 99 basis points of excess return, while the peer group delivered an average negative 30 basis points. Over 10 years, the fund delivered 58 basis points of excess return, while the peer group delivered an average negative 33 basis points.

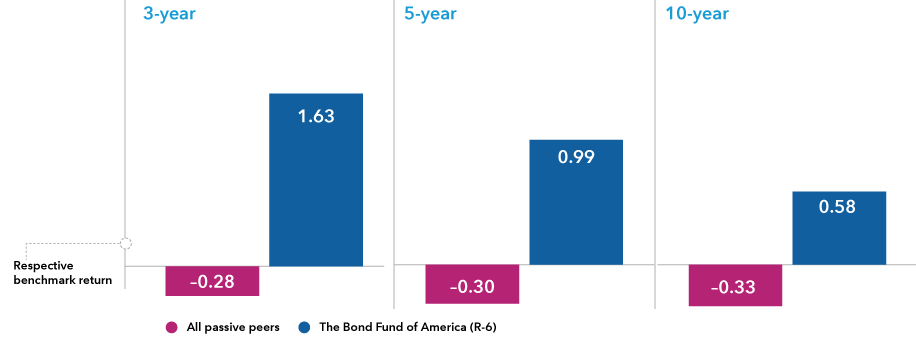
Sources: Capital Group, Morningstar, as of December 31, 2022.
The Morningstar Intermediate Core Bond category includes funds that invest primarily in investment-grade U.S. fixed income issues and typically hold less than 5% in below-investment-grade exposures. Passive funds are not striving to outpace their benchmarks; rather, they seek to replicate the benchmark’s return pattern. When contemplating passive funds versus active fixed income funds, it’s also important to consider, among other things, each fund’s investment objectives and policies, risks, tax implications from portfolio turnover and expenses.

Resilience during equity-market declines

During equity-market declines, The Bond Fund of America has generated strong results relative to its peers.

Cumulative returns (%) during the five largest equity market declines since 2009

Chart shows how the R-6 share class of The Bond Fund of America has held up in equity-market declines. During the period from April 23 to July 2, 2010, the fund yielded 221 basis points; the Morningstar U.S. Intermediate Core-Plus category average yielded 188 basis points; the Morningstar U.S. Multisector Bond Fund category yielded negative 75 basis points; and the S&P 500 Index yielded negative 1,563 basis points. During the period from April 29 to October 3, 2011, the fund yielded 345 basis points; the Morningstar U.S. Intermediate Core-Plus category average yielded 225 basis points; the Morningstar U.S. Multisector Bond Fund category yielded negative 399 basis points; and the S&P 500 Index yielded negative 1,864 basis points. During the period from November 3, 2015, to February 11, 2016, the fund yielded 96 basis points; the Morningstar U.S. Intermediate Core-Plus category average yielded negative 27 basis points; the Morningstar U.S. Multisector Bond Fund category yielded negative 461 basis points; and the S&P 500 Index yielded negative 1,271 basis points. During the period from September 20 to December 24, 2018, the fund yielded 149 basis points; the Morningstar U.S. Intermediate Core-Plus category average yielded 62 basis points; the Morningstar U.S. Multisector Bond Fund category yielded negative 160 basis points; and the S&P 500 Index yielded negative 1,936 basis points. During the period from February 19 to March 23, 2020, the fund yielded negative 111 basis points; the Morningstar U.S. Intermediate Core-Plus category average yielded negative 616 basis points; the Morningstar U.S. Multisector Bond Fund category yielded negative 1,408 basis points; and the S&P 500 Index yielded negative 3,379 basis points.

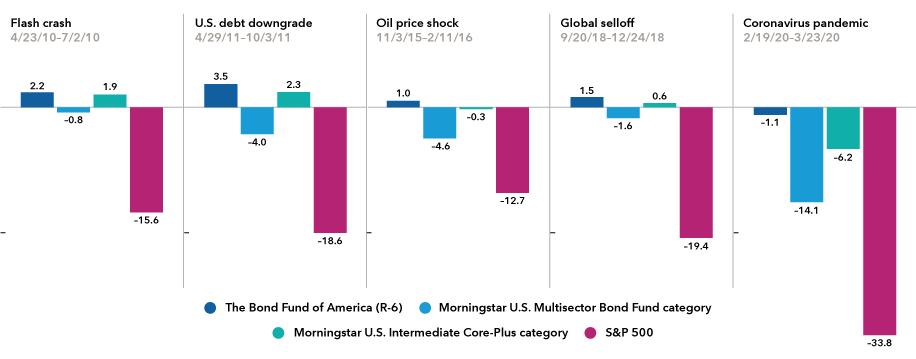
Source: Morningstar.
Data as of March 31, 2023, unless otherwise noted. 
Dates shown are representative of the five largest equity market declines (without dividends reinvested) in the unmanaged S&P 500 with at least 75% recovery. As of March 31, 2023, a correction period is still ongoing, so data for the full correction period is not yet available. There have been periods when the fund has lagged the equity index, such as in rising equity markets. The market indexes are unmanaged and, therefore, have no expenses. Investors cannot invest directly in an index. Past results are not predictive of future results. The returns of the fund and index are based on total returns.

Strong results

Historically, The Bond Fund of America has beaten the Bloomberg U.S. Aggregate Index more often than not.

The fund has outpaced the index

Three pie charts show that the fund outpaced the Bloomberg U.S. Aggregate Index in 94% of monthly rolling three-year periods (125 out of 133); 98% of the time in monthly rolling five-year periods (107 out of 109); and 100% of the time in monthly rolling ten-year periods (49 out of 49).


Sources: Capital Group, Bloomberg Index Services, Ltd., Morningstar. Index is Bloomberg U.S. Aggregate Index. Based on monthly Class R-6 share data for the period 1/1/09 through 12/31/22. On January 1, 2009, The Bond Fund of America's strategy was repositioned from core plus to core fixed income, with its prospectus and guidelines adjusted accordingly.

Want to learn about the fund?

See how this fund can fit into a wealth management portfolio

We're here to help

Our dedicated retirement plan sales support can help you win and retain plans.

*Respective excess returns shown over funds’ respective prospectus benchmark for passive peer groups net of fees from Morningstar Intermediate Core Bond category. Group of passive peers includes passive Intermediate Core Bond category funds. There have been times when the fund has lagged the index.

Unless otherwise indicated, data is as of December 31, 2022, and fund data is for Class R-6 shares. 

The S&P 500 Index is a market capitalization-weighted index based on the results of approximately 500 widely held common stocks. 

The Bloomberg U.S. Aggregate Index represents the U.S. investment-grade fixed-rate bond market. 

Figures shown are past results and are not predictive of results in future periods. Current and future results may be lower or higher than those shown. Investing for short periods makes losses more likely. Prices and returns will vary, so investors may lose money. View mutual fund expense ratios and returns.
Investments are not FDIC-insured, nor are they deposits of or guaranteed by a bank or any other entity, so they may lose value.
Investors should carefully consider investment objectives, risks, charges and expenses. This and other important information is contained in the fund prospectuses and summary prospectuses, which can be obtained from a financial professional and should be read carefully before investing.
The use of derivatives involves a variety of risks, which may be different from, or greater than, the risks associated with investing in traditional securities, such as stocks and bonds.
Lower rated bonds are subject to greater fluctuations in value and risk of loss of income and principal than higher rated bonds.
The return of principal for bond funds and for funds with significant underlying bond holdings is not guaranteed. Fund shares are subject to the same interest rate, inflation and credit risks associated with the underlying bond holdings.
Investing outside the United States involves risks, such as currency fluctuations, periods of illiquidity and price volatility. These risks may be heightened in connection with investments in developing countries.
Capital Group offers a range of share classes designed to meet the needs of retirement plan sponsors and participants. The different share classes incorporate varying levels of financial professional compensation and service provider payments. Because Class R-6 shares do not include any recordkeeping payments, expenses are lower and results are higher. Other share classes that include recordkeeping costs have higher expenses and lower results than Class R-6.
There may have been periods when the results lagged the index(es) and/or average(s). The indexes are unmanaged and, therefore, have no expenses. Investors cannot invest directly in an index.
Source: Bloomberg Index Services Limited. BLOOMBERG® is a trademark and service mark of Bloomberg Finance L.P. and its affiliates (collectively "Bloomberg"). Bloomberg or Bloomberg's licensors own all proprietary rights in the Bloomberg Indices. Neither Bloomberg nor Bloomberg's licensors approves or endorses this material, or guarantees the accuracy or completeness of any information herein, or makes any warranty, express or implied, as to the results to be obtained therefrom and, to the maximum extent allowed by law, neither shall have any liability or responsibility for injury or damages arising in connection therewith.
Each S&P Index ("Index") shown is a product of S&P Dow Jones Indices LLC and/or its affiliates and has been licensed for use by Capital Group. Copyright © 2024 S&P Dow Jones Indices LLC, a division of S&P Global, and/or its affiliates. All rights reserved. Redistribution or reproduction in whole or in part is prohibited without written permission of S&P Dow Jones Indices LLC.
All Capital Group trademarks mentioned are owned by The Capital Group Companies, Inc., an affiliated company or fund. All other company and product names mentioned are the property of their respective companies.
Investment results assume all distributions are reinvested and reflect applicable fees and expenses.
When applicable, results reflect fee waivers and/or expense reimbursements, without which they would have been lower and net expenses higher. Please refer to capitalgroup.com for more information. Read details about how waivers and/or reimbursements affect the results for each fund. View results and yields without fee waiver and/or expense reimbursement.
Certain share classes were offered after the inception dates of some funds. Results for these shares prior to the dates of first sale are hypothetical based on the original share class results without a sales charge, adjusted for typical estimated expenses. 
  • Class R-6 shares were first offered on 5/1/2009.
Results for certain funds with an inception date after the share class inception also include hypothetical returns because those funds' shares sold after the funds' date of first offering. View dates of first sale and specific expense adjustment information.
Use of this website is intended for U.S. residents only. Use of this website and materials is also subject to approval by your home office.
American Funds Distributors, Inc.
This content, developed by Capital Group, home of American Funds, should not be used as a primary basis for investment decisions and is not intended to serve as impartial investment or fiduciary advice.
© 2024 Morningstar, Inc. All Rights Reserved. Some of the information contained herein: (1) is proprietary to Morningstar and/or its content providers; (2) may not be copied or distributed; and (3) is not warranted to be accurate, complete or timely. Neither Morningstar, its content providers nor Capital Group are responsible for any damages or losses arising from any use of this information. Past performance is no guarantee of future results. Information is calculated by Morningstar. Due to differing calculation methods, the figures shown here may differ from those calculated by Capital Group.