American Balanced Fund®

DEFINED CONTRIBUTION FOCUS FUNDS
 

A quality balanced fund aiming for

a smoother long-term ride


A 47-year legacy of success

Over its lifetime, American Balanced Fund has had a higher return than its blended benchmark and peers, and can serve as a QDIA.* 

Hypothetical lifetime value of $10,000 investments

Bar chart shows the hypothetical lifetime value of $10,000 investments: American Balanced Fund, $1,154,106; 60%/40% blend of S&P 500 and Bloomberg U.S. Aggregate Index (reference footnote †), $825,539; Morningstar Allocation 50%-70% Equity, $569,790.
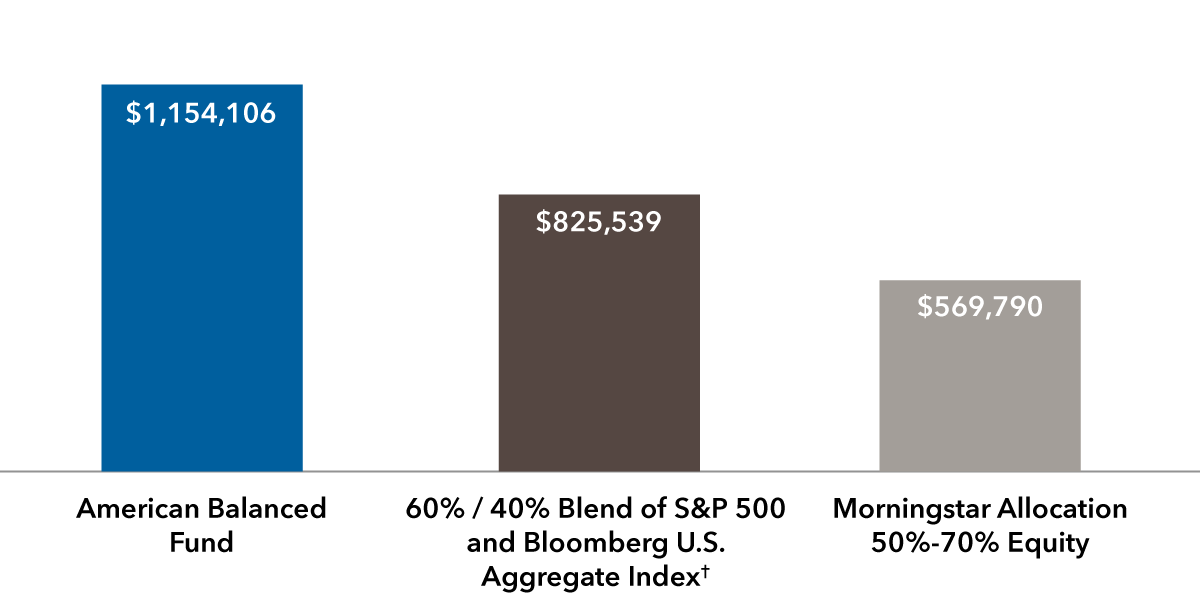
Value of hypothetical $10,000 investments since the fund began on July 26, 1975, through December 31, 2022.

Valuable downside resilience and upside capture

Over monthly rolling 10-year periods since its inception, American Balanced Fund has captured more of its blended benchmark’s gains than losses. And while the fund has led and lagged its benchmark at different times, the fund has outpaced the index by a greater magnitude than it lagged.

Average monthly rolling 10-year periods capture ratio over fund lifetime vs. blended index

Capture ratio1

Excess return when leading/lagging index

Charts show that American Balanced Fund's downside and upside capture ratios were 90% and 100%, respectively; and that American Balanced Fund had an excess return of 1.21% when it led its benchmark index and -0.57% when it trailed its index.
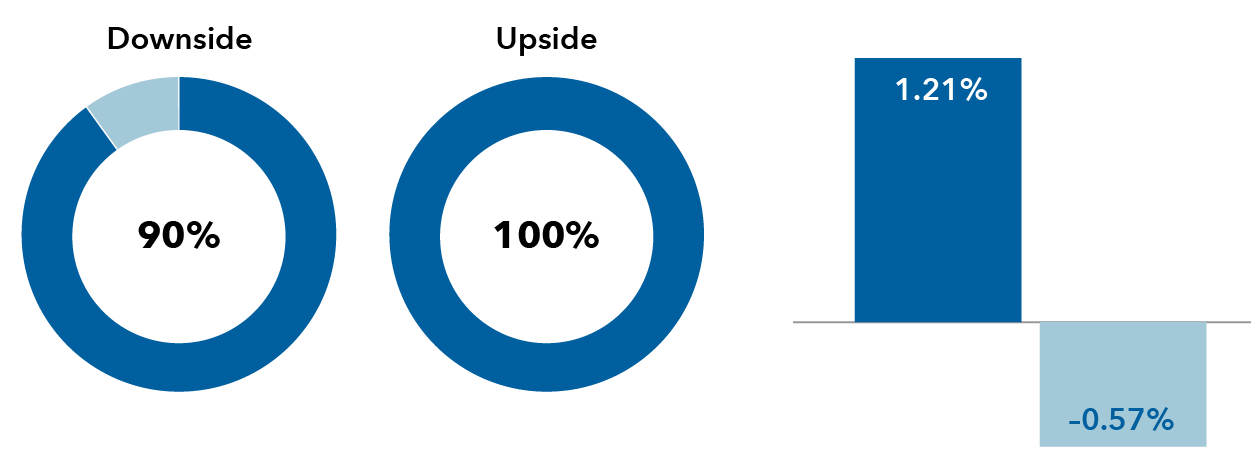
Source: Capital Group. Data as of December 31, 2022. Index consists of a 60% weighting of the S&P 500 Index and 40% weighting of the Bloomberg U.S. Aggregate Index. Up (down) capture ratio is the ratio of a portfolio’s return during periods when the index was up (down), divided by the return of the index during those periods. For example, an up-capture ratio greater than 100 indicates the portfolio produced a higher return than the index during periods when the index was up. Conversely, during periods when the index was down, a down- capture ratio greater than 100 indicates the portfolio produced a lower return than the index.
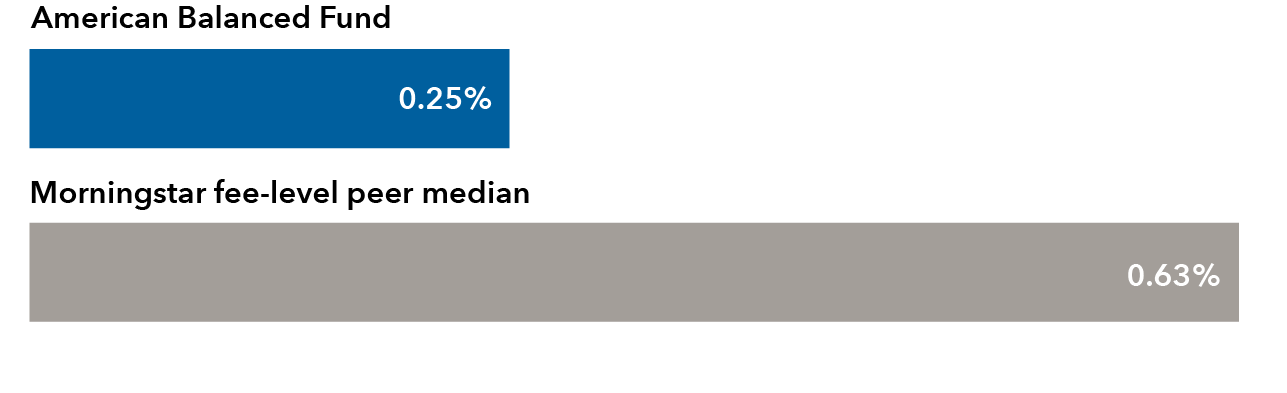
Low fees

American Balanced Fund’s expense ratio was less than half of the median for its peer group.‡ 2


Expense ratio‡ 2

RECOGNITION
morningstar logo

Morningstar Analyst RatingTM

of Silver§

The “most used” defined

 contribution plan balanced/

asset allocation fund**

morningstar logo

Morningstar

“Thrilling 30” fund††

Want to learn more about the fund?

We're here to help

Our dedicated retirement plan sales support can help you win and retain plans.

* Plan sponsors should consult a financial professional before selecting an investment option other than a target date series as a qualified default investment alternative (QDIA).

Blends the S&P 500 Index with the Bloomberg U.S. Aggregate Index by weighting their total returns at 60% and 40%, respectively. Results assume the blend is rebalanced monthly. The Bloomberg U.S. Aggregate Index began on January 1, 1976. For index results prior to that date, the Bloomberg Government/Credit Bond Index was used.

The fund’s Class R-6 share expense ratio is as of the most recent prospectus available at the time of publication. The peer group expense ratio median was calculated based on funds in the following Morningstar Fee Level Group — Distribution category: Moderate Allocation Retirement, Large, as of December 31, 2022.

§ As of March 21, 2023, based on Class R-6 shares.

** Source: “Mutual funds most used by DC plans, by asset class 2022,” Pensions & Investments, November 2, 2022, based on assets as of June 30, 2022, Balanced/asset allocation category.

†† Source: Morningstar, "The Thrilling 30" by Russel Kinnel, September 29, 2023. Morningstar's screening took into consideration expense ratios, manager ownership, returns over manager's tenure, and Morningstar Risk, Medalist and Parent ratings. The universe was limited to share classes accessible to individual investors with a minimum investment no greater than $50,000, did not include funds of funds, and must be rated by Morningstar analysts. Class A shares were evaluated for American Funds. Visit morningstar.com for more details.

Unless otherwise indicated, data is as of December 31, 2022, and fund data is for Class R-6 shares.

Bloomberg U.S. Aggregate Index represents the U.S. investment-grade fixed-rate bond market.

S&P 500 Index is a market capitalization-weighted index based on the results of approximately 500 widely held common stocks.

These indexes are unmanaged, and their results include reinvested dividends and/or distributions but do not reflect the effect of sales charges, commissions, account fees, expenses or U.S. federal income taxes.

The Morningstar Allocation 50%–70% Equity category includes funds that typically seek to provide both income and capital appreciation by investing in multiple asset classes, including stocks, bonds and cash. These portfolios are dominated by domestic holdings and have equity exposures between 50% and 70%.

Source: Morningstar. Analyst rating as of March 21, 2023.

Figures shown are past results and are not predictive of results in future periods. Current and future results may be lower or higher than those shown. Investing for short periods makes losses more likely. Prices and returns will vary, so investors may lose money. View mutual fund expense ratios and returns.
Investments are not FDIC-insured, nor are they deposits of or guaranteed by a bank or any other entity, so they may lose value.
Investors should carefully consider investment objectives, risks, charges and expenses. This and other important information is contained in the fund prospectuses and summary prospectuses, which can be obtained from a financial professional and should be read carefully before investing.
The return of principal for bond funds and for funds with significant underlying bond holdings is not guaranteed. Fund shares are subject to the same interest rate, inflation and credit risks associated with the underlying bond holdings.
The Morningstar Analyst Rating™ is not a credit or risk rating. It is a subjective evaluation performed by Morningstar's manager research group, which consists of various Morningstar, Inc. subsidiaries (“Manager Research Group”). In the United States, that subsidiary is Morningstar Research Services LLC, which is registered with and governed by the U.S. Securities and Exchange Commission. The Manager Research Group evaluates funds based on five key pillars, which are process, performance, people, parent, and price. The Manager Research Group uses this five-pillar evaluation to determine how they believe funds are likely to perform relative to a benchmark over the long term on a risk adjusted basis. They consider quantitative and qualitative factors in their research. For actively managed strategies, people and process each receive a 45% weighting in their analysis, while parent receives a 10% weighting. For passive strategies, process receives an 80% weighting, while people and parent each receive a 10% weighting. For both active and passive strategies, performance has no explicit weight as it is incorporated into the analysis of people and process; price at the share-class level (where applicable) is directly subtracted from an expected gross alpha estimate derived from the analysis of the other pillars. The impact of the weighted pillar scores for people, process and parent on the final Analyst Rating is further modified by a measure of the dispersion of historical alphas among relevant peers. For certain peer groups where standard benchmarking is not applicable, primarily peer groups of funds using alternative investment strategies, the modification by alpha dispersion is not used. The Analyst Rating scale is Gold, Silver, Bronze, Neutral, and Negative. For active funds, a Morningstar Analyst Rating of Gold, Silver, or Bronze reflects the Manager Research Group's expectation that an active fund will be able to deliver positive alpha net of fees relative to the standard benchmark index assigned to the Morningstar category. The level of the rating relates to the level of expected positive net alpha relative to Morningstar category peers for active funds. For passive funds, a Morningstar Analyst Rating of Gold, Silver, or Bronze reflects the Manager Research Group's expectation that a fund will be able to deliver a higher alpha net of fees than the lesser of the relevant Morningstar category median or 0. The level of the rating relates to the level of expected net alpha relative to Morningstar category | Morningstar Analyst and Quantitative Rating Morningstar Essentials 31 peers for passive funds. For certain peer groups where standard benchmarking is not applicable, primarily peer groups of funds using alternative investment strategies, a Morningstar Analyst Rating of Gold, Silver, or Bronze reflects the Manager Research Group's expectation that a fund will deliver a weighted pillar score above a predetermined threshold within its peer group. Analyst Ratings ultimately reflect the Manager Research Group's overall assessment, are overseen by an Analyst Rating Committee, and are continuously monitored and reevaluated at least every 14 months. For more detailed information about Morningstar's Analyst Rating, including its methodology, please go to shareholders.morningstar.com/investor-relations/governance/Compliance--Disclosure/default.aspx. The Morningstar Analyst Rating (i) should not be used as the sole basis in evaluating a fund, (ii) involves unknown risks and uncertainties which may cause the Manager Research Group's expectations not to occur or to differ significantly from what they expected, and (iii) should not be considered an offer or solicitation to buy or sell the fund.
Capital Group offers a range of share classes designed to meet the needs of retirement plan sponsors and participants. The different share classes incorporate varying levels of financial professional compensation and service provider payments. Because Class R-6 shares do not include any recordkeeping payments, expenses are lower and results are higher. Other share classes that include recordkeeping costs have higher expenses and lower results than Class R-6.
There may have been periods when the results lagged the index(es) and/or average(s). The indexes are unmanaged and, therefore, have no expenses. Investors cannot invest directly in an index.
Source: Bloomberg Index Services Limited. BLOOMBERG® is a trademark and service mark of Bloomberg Finance L.P. and its affiliates (collectively "Bloomberg"). Bloomberg or Bloomberg's licensors own all proprietary rights in the Bloomberg Indices. Neither Bloomberg nor Bloomberg's licensors approves or endorses this material, or guarantees the accuracy or completeness of any information herein, or makes any warranty, express or implied, as to the results to be obtained therefrom and, to the maximum extent allowed by law, neither shall have any liability or responsibility for injury or damages arising in connection therewith.
Each S&P Index ("Index") shown is a product of S&P Dow Jones Indices LLC and/or its affiliates and has been licensed for use by Capital Group. Copyright © 2024 S&P Dow Jones Indices LLC, a division of S&P Global, and/or its affiliates. All rights reserved. Redistribution or reproduction in whole or in part is prohibited without written permission of S&P Dow Jones Indices LLC.
All Capital Group trademarks mentioned are owned by The Capital Group Companies, Inc., an affiliated company or fund. All other company and product names mentioned are the property of their respective companies.
Investment results assume all distributions are reinvested and reflect applicable fees and expenses.
When applicable, results reflect fee waivers and/or expense reimbursements, without which they would have been lower and net expenses higher. Please refer to capitalgroup.com for more information. Read details about how waivers and/or reimbursements affect the results for each fund. View results and yields without fee waiver and/or expense reimbursement.
Certain share classes were offered after the inception dates of some funds. Results for these shares prior to the dates of first sale are hypothetical based on the original share class results without a sales charge, adjusted for typical estimated expenses. 
  • Class R-6 shares were first offered on 5/1/2009.
Results for certain funds with an inception date after the share class inception also include hypothetical returns because those funds' shares sold after the funds' date of first offering. View dates of first sale and specific expense adjustment information.
  1. Calculated by Capital Group. Due to differing calculation methods, the figures shown here may differ from those calculated by Morningstar.
  2. Expense ratios are as of each fund's prospectus available at the time of publication.
Use of this website is intended for U.S. residents only. Use of this website and materials is also subject to approval by your home office.
American Funds Distributors, Inc.
This content, developed by Capital Group, home of American Funds, should not be used as a primary basis for investment decisions and is not intended to serve as impartial investment or fiduciary advice.
© 2024 Morningstar, Inc. All Rights Reserved. Some of the information contained herein: (1) is proprietary to Morningstar and/or its content providers; (2) may not be copied or distributed; and (3) is not warranted to be accurate, complete or timely. Neither Morningstar, its content providers nor Capital Group are responsible for any damages or losses arising from any use of this information. Past performance is no guarantee of future results. Information is calculated by Morningstar. Due to differing calculation methods, the figures shown here may differ from those calculated by Capital Group.