Investment Fund

Purchase Restrictions: Class R-6 shares are available in certain employer-sponsored retirement plans. See the prospectus for details.

Overview

Internal Prompt
A dedicated emerging markets allocation. Seeks to provide long term growth of capital through a diversified portfolio of developing country equities with an emphasis on companies growing faster than their global peers and/or trading at substantial discount.
Price at NAV $6.44 as of 4/18/2024 (updated daily)
Fund Assets (millions) $1,364.3
Portfolio Managers
4
Expense Ratio
(Gross/Net %)
0.73 / 0.73%

Internal Prompt

Returns at NAV

Returns at MOP

Asset Mix

U.S. Equities1.1%
Non-U.S. Equities95.6%
U.S. Bonds0.0%
Non-U.S. Bonds0.0%
Cash & Equivalents
3.3%
As of 3/31/2024 (updated monthly)
Internal Prompt

Volatility & Return

Read important investment disclosures

Equities

For Class R-6 Shares, this chart tracks the 10-year standard deviation
and 10-year annualized return of the equity funds
REFGX
MSCI Emerging Markets IMI Index (linked)
Other AF Funds
Standard Deviation as of 03/31/2024 (updated monthly) . Annualized return as of 03/31/2024 (updated monthly) .
VIEW LARGER CHART

Market Capitalization

82.8%
Large
14.4%
Medium
2.9%
Small
$25,448.81 Million
Weighted Average


As of 6/30/2023 (updated quarterly). Morningstar data as of 12/31/2023 (updated quarterly).

Morningstar Ownership ZoneTM

Diversified Emerging Mkts
Weighted average of holdings
75% of fund's stock holdings
Morningstar data as of 12/31/23 (updated quarterly)

Description

Objective
The fund's investment objective is to seek long-term capital growth.
Distinguishing Characteristics
The fund invests at least 90% of its net assets in common stock and other equity securities of issuers in developing countries.
Types of Investments
The fund invests primarily in developing country equity securities.
Portfolio Restrictions
The fund may invest no more than 10% of its assets in securities of issuers that are in a developing country that is not a Qualified Market. Qualified Markets are countries that have securities markets designated for investment by the funds investment adviser after taking into account, among other factors, market liquidity, the availability of information about the market and the impact of applicable government regulation. The fund may also invest up to 10% of its net assets in securities of issuers that are not in developing countries, provided that at least 75% of such issuers' assets are in developing countries, or such issuers derive or expect to derive at least 75% of their total revenue or profits from goods or services produced in or sales made in developing countries.

Fund Facts

Fund Inception 5/30/1986
Fund Assets (millions)
As of 2/29/2024
$1,364.3
Companies/Issuers
Holdings are as of 3/31/2024 (updated monthly).
135+
Shareholder Accounts
Shareholder accounts are as of 3/31/2024
2
Regular Dividends Paid
Dec
Minimum Initial Investment $1,000,000
Capital Gains Paid
Dec
Portfolio Turnover (2023) 38%
Fiscal Year-End Jun
Prospectus Date 09/01/2023
CUSIP 290886 30 8
Fund Number 26115

Returns

Internal Prompt

Month-End Returns as of 3/31/24

Quarter-End Returns as of 3/31/24

Growth of 10K

Read important investment disclosures
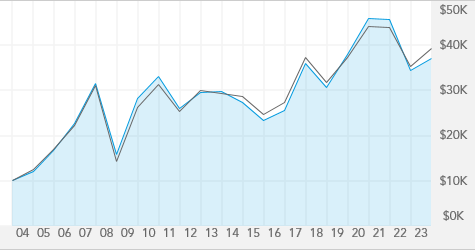
For Class R-6 Shares, this chart tracks a hypothetical investment with dividends reinvested, over the last 20 years, or since inception date if the fund has been in existence under 20 years, through 12/31/2023.
REFGX
MSCI Emerging Markets IMI Index (linked)

High & Low Prices

Internal Prompt

Yield

12-month
Distribution Rates
30-day SEC Yield
Fund at NAV 1.44% 1.68%
Fund at MOP N/A N/A
As of 3/31/2024 (updated monthly)

Valuation

Price/ Price/ Price/
Book Cash Flow Earnings
Fund 1.87 8.82 12.41
MSCI Emerging Markets IMI Index (linked)
1.50 6.90 11.90
Fund as of 12/31/23. Index as of 12/31/23.
Years of Experience with Fund
Years of Experience with Capital Group
Years of Experience with Investment Industry
Arthur Caye 6 19 27
Eu-Gene Cheah 6 26
Victor D. Kohn 29 38 40
F. Chapman Taylor 7 29
A boldface number indicates that years of experience with Capital Group is equal to years of experience with investment industry.

Portfolio Composition

Morningstar Rating TM


Overall Morningstar RatingTM
Funds rated(721)
3-yr. Morningstar RatingTM
(721 funds rated)
5-yr. Morningstar RatingTM
(657 funds rated)
10-yr. Morningstar RatingTM
(425 funds rated)
Overall Morningstar Risk Average
HIGH
LOW
Category Diversified Emerging Mkts
Ratings are based on risk-adjusted returns as of 3/31/2024 (updated monthly).
Internal Prompt

Lipper Leader Scorecard

Over-all 3 yr. 5 yr. 10 yr.
Consistent Return Within Category
Funds Rated

(687)

(687)

(624)
Expense Within Category
Funds Rated

(464)

(464)

(415)
Preservation Within Category
Funds Rated

(12478)

(12478)

(11421)
Tax Efficiency Within Category
Funds Rated

(686)

(686)

(624)
Total Return Within Category
Funds Rated

(688)

(688)

(624)
Category Emerging Markets Funds
KEY
HIGHEST LOWEST
As of 3/31/2024 (updated monthly)

Risk Measures

Fund
Standard Deviation
17.54
Sharpe Ratio
0.16
For the 10 Years ending 3/31/24 (updated monthly).
American Funds
Benchmark
Morningstar
Benchmark
MSCI Emerging Markets IMI Index (linked)
MSCI ACWI Ex USA NR USD
R-squared 93 79
Beta 0.99 1.04
Capture Ratio (Downside/Upside) 100/98 108/100
American Funds Benchmark for the 10 Years ending 3/31/24 (updated monthly).
Morningstar Benchmark for the 10 Years ending 3/31/24 (updated monthly).

Holdings

Equities Breakdown

Equity Fund Holdings
Financials 20.3%
Consumer discretionary 16.9%
Information technology 13.6%
Health care 12.9%
Communication services 12.9%
Industrials 7.9%
Consumer staples 7.3%
Real estate 2.1%
Materials 1.3%
Energy 0.8%
Utilities 0.7%

% of net assets as of 3/31/2024 (updated monthly)

Top Equities

TSMC
6.7%
NetEase
3.9%
Samsung Electronics
3.2%
Innovent Biologics
2.8%
BeiGene
2.8%
Ping An Insurance
2.7%
Hengrui Medicine
2.6%
MakeMyTrip
2.5%
Alibaba Group
2.5%
Trip.com Group
2.1%

% of net assets as of 3/31/2024 (updated monthly)

Geographic Breakdown

United States
1.1%
Europe
1.8%
Asia & Pacific Basin
76.4%
Other (Including Canada & Latin America)
17.4%
Cash & equivalents
3.3%
% of net assets as of 3/31/2024 (updated monthly)

The New Geography of Investing ®

Regions Fund
MSCI Emerging Markets IMI Index (linked)
United States 1.1% 0.0%
Europe 1.1% 0.0%
Asia-Pacific ex. Japan 0.3% 0.0%
Emerging Markets 97.5% 100.0%

% of net assets as of 3/31/2024 (updated monthly)

Fund Breakdown by Domicile

Regions Fund
MSCI Emerging Markets IMI Index (linked)
United States 1.1% 0.0%
Europe 1.0% 0.0%
Asia-Pacific ex. Japan 0.3% 0.0%
Emerging Markets 94.2% 100.0%
Cash & Equivalents
3.3% 0.0%

% of net assets as of 3/31/2024 (updated monthly)

Prices & Distributions

Internal Prompt

Historical Prices Month-End

Historical Prices Year-End

Internal Prompt

Historical Distributions as of 01/25/24

2023
Record
Date
Calculated
Date
Pay Date
Income Dividend Regular
Income Dividend Special
Cap. Gains Long-Term
Cap. Gains Short-Term
Reinvest NAV
12/21/23 12/21/23 12/22/23 $0.0973 $0.00 $0.00 $0.00 $6.52
2023 Year-to-Date: Dividends Subtotal: $0.0973 Cap Gains Subtotal: $0.00
Total Distributions: $0.0973

Fees & Expenses

Internal Prompt

Fees

Annual Management Fees 0.62%
Other Expenses 0.11%
Service 12b-1 --
As of each fund's most recent prospectus.
Internal Prompt

Expense Ratio

REFGX 0.73%
Lipper Emerging Markets Funds Average
--%
Fund as of most recent prospectus. Lipper Category as of -- (updated quarterly).

Resources