
FACTORS DRIVING OUR SUCCESS
Our Series is built from strong underlying funds
Percentage of rolling 10-year periods in which the Series’ underlying American Funds outpaced peers

![]()
“Morningstar Medalists account for more than 90% of the series’ assets, a remarkable feat considering it consists entirely of actively managed funds.”
Morningstar Target-Date Fund Series Report
January 25, 2023
Based on Class R-6 share results versus Lipper indexes for rolling calendar-year periods starting the first full calendar year after each fund's inception through December 31, 2022. Periods covered are the fund's lifetime or since the comparable Lipper index inception date (except Capital Income Builder and SMALLCAP World Fund, for which the Lipper average was used). This analysis excludes American Funds Multi-Sector Income Fund and American Funds Strategic Bond Fund, which began on March 22, 2019, and March 1, 2016, respectively. Equity funds outpaced Lipper indexes in 91% of rolling periods. Fixed income funds outpaced in 69% of rolling periods.
Equity that has excelled
Our funds have a long history of beating the market while limiting downside risk, helping participants pursue their goals of both building and preserving wealth.
-
-
Build wealth
Lifetime returns of underlying American Funds equity-focused funds vs. relevant benchmark indexes
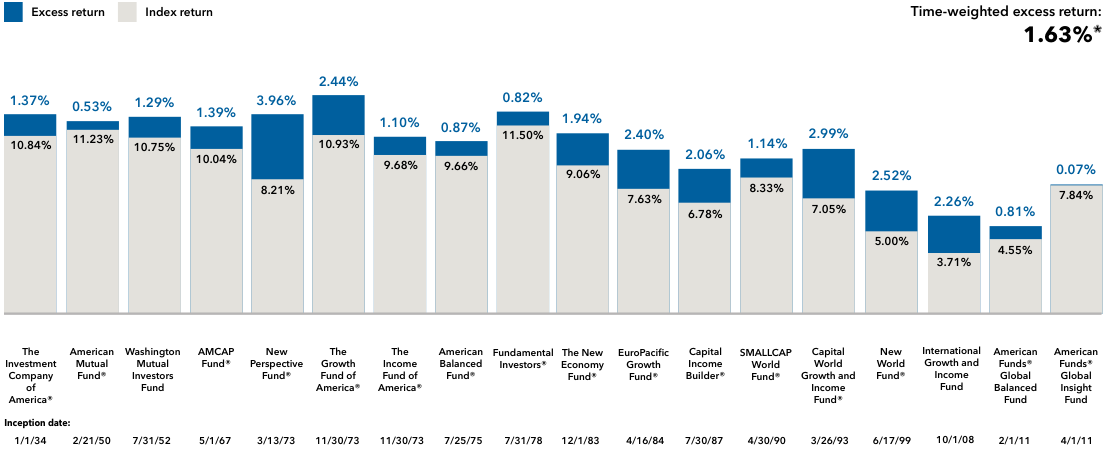
Source: Capital Group. Returns are average annual total returns for benchmark indexes and average annual excess total return for funds at net asset value for Class R-6 shares from fund inception through December 31, 2022. Please see the “Lifetime results methodology” section below for more details on methodology. Market indexes are unmanaged and, therefore, have no expenses. Investors cannot invest directly in an index. There have been periods when the funds have lagged the index.
*Time-weighted average annual excess return across all 18 equity-focused underlying American Funds. The equal-weighted average annual excess return is 1.66%. The time-weighted average gives greater emphasis to those funds that have been in existence longer. For example, this means the 1.37% annualized difference between The Investment Company of America and its benchmark is given proportionally greater weighting when calculating the average across all 18 funds in alignment with its more than 80 years of existence.
-
Preserve wealth
Lifetime downside capture ratio of underlying equity funds
Versus relevant benchmark indexes
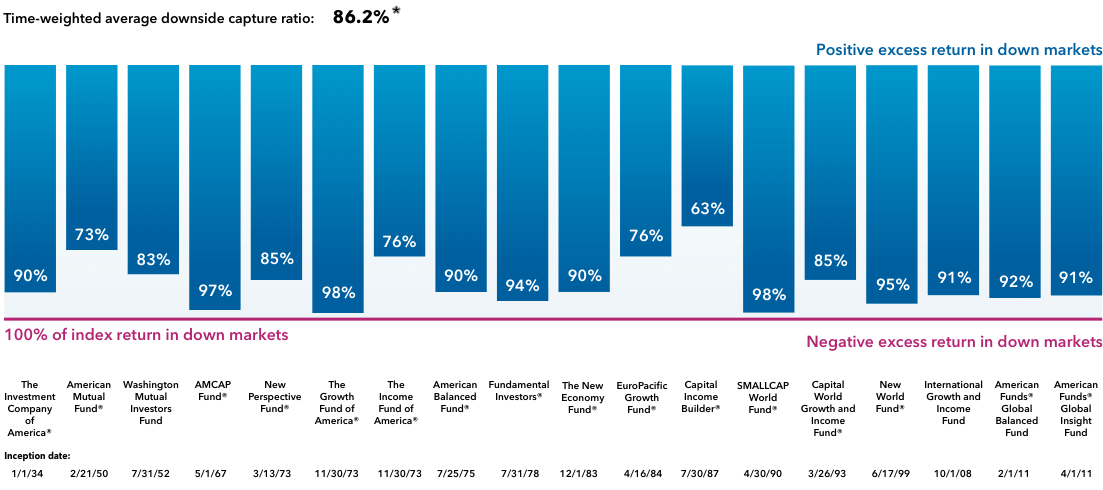
Source: Capital Group. Data for downside capture are based on monthly returns for Class R-6 shares from fund inception through December 31, 2022. Please see the “Lifetime results methodology” section below for more details on methodology. Market indexes are unmanaged and, therefore, have no expenses. Investors cannot invest directly in an index. There have been periods when the funds have lagged the index.
The downside capture ratio measures the extent to which a manager has limited negative absolute returns, relative to the market’s decline. Market declines are defined as those months in which the market return was negative. This ratio is akin to a downside beta, specifying the percentage of the down market “captured” by the manager. If, for example, it is greater than 100%, then the manager has trailed in the down market. Conversely, a percentage less than 100% indicates a positive excess return for those market declines; the smaller, the better. Market indexes are unmanaged and, therefore, have no expenses. Investors cannot invest directly in an index.
*Time-weighted average annual excess return across all 18 equity-focused underlying American Funds. The equal-weighted average downside capture ratio is 86.95%. The time-weighted average gives greater emphasis to those funds that have been in existence longer. For example, the 90% downside capture ratio of The Investment Company of America versus its benchmark is given proportionally greater weighting in alignment with its more than 80 years of existence when calculating the average across all 18 funds.
-


Bond funds that have diversified
Many of our bond funds stress low correlation* to equities, which can help cushion equity downturns.
Fixed income funds that have had low equity correlation
Three-year correlation to S&P 500 Index: American Funds vs. peer group average

Source: Morningstar. Data as of December 31, 2022. Results based on Class R-6 shares. The funds’ Morningstar categories are: U.S. Intermediate Government for U.S. Government Securities Fund and American Funds Mortgage Fund; U.S. Short-Term Bond for Intermediate Bond Fund of America and Short-Term Bond Fund of America; U.S. Intermediate Core Bond for The Bond Fund of America; U.S. Inflation-Protected Bond for American Funds Inflation Linked Bond Fund; U.S. World Bond for Capital World Bond Fund; U.S. High Yield Bond for American High-Income Trust; U.S. Fund Intermediate Core-Plus Bond for American Funds Strategic Bond Fund; and U.S. Fund Multisector Bond for American Funds Multi-Sector Income Fund.
*Correlation is a statistical measure of how a security and an index move in relation to each other. A correlation ranges from –1 to 1. A positive correlation close to 1 implies that as one moves, either up or down, the other will move in “lockstep” in the same direction. A negative correlation close to –1 indicates the two have moved in the opposite direction.
Each building block plays a role
Each underlying fund offers a different risk, return and income profile — building a series that more closely aligns with participant needs for every stage of life.
Interact with the visualization below to explore the differentiated return, risk and income characteristics of each component.


Source: Capital Group. The target allocations shown are as of June 30, 2023, and are subject to the oversight committee’s discretion. The investment adviser anticipates assets will be invested within a range that deviates no more than 10% above or below the allocations shown in the prospectus/characteristics statement. Underlying funds may be added or removed during the year. Visit capitalgroup.com for current allocations.
Based on the 30-day SEC yield, annualized standard deviation and average annual return of the underlying funds for Class R-6 shares for the three years ending June 30, 2023. Values rounded to tenths. Annualized standard deviation (based on monthly returns) is a common measure of absolute volatility that tells how returns over time have varied from the mean. A lower number signifies lower volatility. The 30-day SEC yield reflects the rate at which the fund is earning income on its current portfolio of securities calculated in accordance with the SEC formula. View current mutual fund SEC yield.
LOW FEES
Delivering value at a low cost
We encourage a focus not just on expenses but on value delivered to participants.
GLIDE PATH
A distinctive approach
Our glide path is different. While our Series changes the mix between stocks and bonds, it also changes the types of assets held. This is designed to better align with participant needs over time.
HOMEPAGE
Discover what sets our Series apart
Target date funds have a lot in common. But the American Funds Target Date Series takes a distinctive approach that has delivered uncommon investment outcomes and helped thousands of participants come closer to achieving their financial goals.
Compare us to the competition
View our funds
Contact us
Our team is ready to help you help participants.
Important investment disclosures
Figures shown are past results and are not predictive of results in future periods. Current and future results may be lower or higher than those shown. Investing for short periods makes losses more likely. Prices and returns will vary, so investors may lose money. View mutual fund expense ratios and returns.
Investments are not FDIC-insured, nor are they deposits of or guaranteed by a bank or any other entity, so they may lose value.
Investors should carefully consider investment objectives, risks, charges and expenses. This and other important information is contained in the fund prospectuses and summary prospectuses, which can be obtained from a financial professional and should be read carefully before investing.
The use of derivatives involves a variety of risks, which may be different from, or greater than, the risks associated with investing in traditional securities, such as stocks and bonds.
Lower rated bonds are subject to greater fluctuations in value and risk of loss of income and principal than higher rated bonds.
The return of principal for bond funds and for funds with significant underlying bond holdings is not guaranteed. Fund shares are subject to the same interest rate, inflation and credit risks associated with the underlying bond holdings.
While not directly correlated to changes in interest rates, the values of inflation-linked bonds generally fluctuate in response to changes in real interest rates and may experience greater losses than other debt securities with similar durations.
Although the target date portfolios are managed for investors on a projected retirement date time frame, the allocation strategy does not guarantee that investors' retirement goals will be met. Investment professionals manage the portfolio, moving it from a more growth-oriented strategy to a more income-oriented focus as the target date gets closer. The target date is the year that corresponds roughly to the year in which an investor is assumed to retire and begin taking withdrawals. Investment professionals continue to manage each portfolio for approximately 30 years after it reaches its target date.
American Funds Strategic Bond Fund may engage in frequent and active trading of its portfolio securities, which may involve correspondingly greater transaction costs, adversely affecting the fund's results.
Investing outside the United States involves risks, such as currency fluctuations, periods of illiquidity and price volatility. These risks may be heightened in connection with investments in developing countries.
Small-company stocks entail additional risks, and they can fluctuate in price more than larger company stocks.
Capital Group offers a range of share classes designed to meet the needs of retirement plan sponsors and participants. The different share classes incorporate varying levels of financial professional compensation and service provider payments. Because Class R-6 shares do not include any recordkeeping payments, expenses are lower and results are higher. Other share classes that include recordkeeping costs have higher expenses and lower results than Class R-6.
There may have been periods when the results lagged the index(es) and/or average(s). The indexes are unmanaged and, therefore, have no expenses. Investors cannot invest directly in an index.
MSCI has not approved, reviewed or produced this report, makes no express or implied warranties or representations and is not liable whatsoever for any data in the report. You may not redistribute the MSCI data or use it as a basis for other indices or investment products.
Source: Bloomberg Index Services Limited. BLOOMBERG® is a trademark and service mark of Bloomberg Finance L.P. and its affiliates (collectively "Bloomberg"). Bloomberg or Bloomberg's licensors own all proprietary rights in the Bloomberg Indices. Neither Bloomberg nor Bloomberg's licensors approves or endorses this material, or guarantees the accuracy or completeness of any information herein, or makes any warranty, express or implied, as to the results to be obtained therefrom and, to the maximum extent allowed by law, neither shall have any liability or responsibility for injury or damages arising in connection therewith.
Each S&P Index ("Index") shown is a product of S&P Dow Jones Indices LLC and/or its affiliates and has been licensed for use by Capital Group. Copyright © 2024 S&P Dow Jones Indices LLC, a division of S&P Global, and/or its affiliates. All rights reserved. Redistribution or reproduction in whole or in part is prohibited without written permission of S&P Dow Jones Indices LLC.
Statements attributed to an individual represent the opinions of that individual as of the date published and do not necessarily reflect the opinions of Capital Group or its affiliates. This information is intended to highlight issues and should not be considered advice, an endorsement or a recommendation.
All Capital Group trademarks mentioned are owned by The Capital Group Companies, Inc., an affiliated company or fund. All other company and product names mentioned are the property of their respective companies.
Investment results assume all distributions are reinvested and reflect applicable fees and expenses.
When applicable, results reflect fee waivers and/or expense reimbursements, without which they would have been lower and net expenses higher. Please refer to capitalgroup.com for more information. Read details about how waivers and/or reimbursements affect the results for each fund. View results and yields without fee waiver and/or expense reimbursement.
Certain share classes were offered after the inception dates of some funds. Results for these shares prior to the dates of first sale are hypothetical based on the original share class results without a sales charge, adjusted for typical estimated expenses.
- Class R-6 shares were first offered on 5/1/2009.
Use of this website is intended for U.S. residents only.
American Funds Distributors, Inc.
This content, developed by Capital Group, home of American Funds, should not be used as a primary basis for investment decisions and is not intended to serve as impartial investment or fiduciary advice.
© 2024 Morningstar, Inc. All Rights Reserved. Some of the information contained herein: (1) is proprietary to Morningstar and/or its content providers; (2) may not be copied or distributed; and (3) is not warranted to be accurate, complete or timely. Neither Morningstar, its content providers nor Capital Group are responsible for any damages or losses arising from any use of this information. Past performance is no guarantee of future results. Information is calculated by Morningstar. Due to differing calculation methods, the figures shown here may differ from those calculated by Capital Group.
Lifetime results methodology
The 18 American Funds equity-focused funds used in our analysis (and the relevant indexes/index blends to which they were compared) are: AMCAP Fund, American Mutual Fund, Fundamental Investors, The Growth Fund of America, The Investment Company of America and Washington Mutual Investors Fund (S&P 500); American Balanced Fund (60% S&P 500/40% Bloomberg U.S. Aggregate); American Funds Global Balanced Fund (60% MSCI All Country World/40% Bloomberg Global Aggregate); Capital Income Builder (70% MSCI All Country World/30% Bloomberg U.S. Aggregate); The Income Fund of America (65% S&P 500/35% Bloomberg U.S. Aggregate); Capital World Growth and Income Fund, New Perspective Fund, New World Fund, and The New Economy Fund (MSCI All Country World); EuroPacific Growth Fund and International Growth and Income Fund (MSCI All Country World ex USA); SMALLCAP World Fund (MSCI All Country World Small Cap); and American Funds Global Insight Fund (MSCI World). Each listed index is the funds' primary benchmark, with the exception of American Balanced Fund, American Funds Global Balanced Fund, Capital Income Builder and The Income Fund of America. Each of these funds has two primary benchmarks (the indexes listed above, which are rebalanced monthly).
Some of these indexes lack sufficient history to cover the lifetime of certain funds. Comparable indexes were used for those periods. For American Balanced Fund, a 60% S&P 500/40% Bloomberg U.S. Government/Credit index blend was used for the period between July 26, 1975 (the fund's inception) and December 31, 1975. For Capital Income Builder, a 70% MSCI World/30% Bloomberg U.S. Aggregate index blend was used for the period between July 30, 1987 (the fund's inception) and December 31, 1987. For The Income Fund of America, a 65% S&P 500/35% Bloomberg U.S. Government/Credit index blend was used for the period between November 30, 1973 (the fund's inception) and December 31, 1975. For EuroPacific Growth Fund, the MSCI EAFE (Europe, Australasia, Far East) Index was used for the period between April 16, 1984 (the fund's inception) and March 31, 2007. For New Perspective Fund, the MSCI World Index was used for the period between March 13, 1973 (the fund's inception) and September 30, 2011. For SMALLCAP World Fund, the S&P Global <$3 Billion Index (formerly the S&P Global <$1.2 Billion Index) was used for the period between April 30, 1990 (the fund's inception) and September 30, 2009. For Capital World Growth and Income Fund, the MSCI World Index was used for the period between January 1, 1970 (the fund's inception) and November 30, 2011. For International Growth and Income Fund, the MSCI World Index ex USA was used for the period between January 1, 1970 (the fund's inception) and June 30, 2011.
Index definitions
The Bloomberg U.S. Aggregate Index represents the U.S. investment-grade, fixed-rate bond market.
The Bloomberg U.S. Credit Index is a market-value-weighted index that tracks the total return results of publicly issued U.S. corporate and specified foreign debentures and secured notes that meet specified maturity, liquidity and quality requirements.
The Bloomberg U.S. Government Index measures the performance of the U.S. Treasury and U.S. Agency indexes, including Treasuries and U.S. agency debentures.
The Bloomberg U.S. Government/Credit Index measures U.S. dollar-denominated, fixed-rate, nominal debt issued by the U.S. Treasury.
The MSCI All Country World Index (ACWI) is a free-float-adjusted, market-capitalization-weighted index that measures equity market results in global developed and emerging markets. It consists of more than 40 indexes in developed and emerging markets.
The MSCI All Country World Index (ACWI) ex USA is a free-float-adjusted, market-capitalization-weighted index that measures equity market results in global developed and emerging markets, excluding the United States. It consists of more than 40 indexes in developed and emerging markets.
The MSCI All Country World Small Cap Index is a free-float-adjusted, market-capitalization-weighted index that measures equity market results of smaller capitalization companies in developed and emerging markets.
The MSCI EAFE (Europe, Australasia, Far East) Index is a free-float-adjusted, market-capitalization-weighted index that measures developed equity market results, excluding the United States and Canada.
The MSCI World Index is a free-float-adjusted, market-capitalization-weighted index that measures equity results in developed markets. It consists of more than 20 indexes in developed markets.
The MSCI World Index ex USA is a free-float-adjusted, market-capitalization-weighted index that measures equity results in developed markets, excluding the United States. It consists of more than 20 indexes in developed markets.
The S&P 500 Index is a market-capitalization-weighted index that represents approximately 500 widely held common stocks.
The S&P Target Date indexes are a series of indexes composed of different allocations to stocks, bonds and short-term investments that reflect reductions in potential risk over time.