
FACTORS DRIVING OUR SUCCESS
Discover what sets our Series apart
Target date funds have a lot in common. But the American Funds Target Date Series takes a distinctive approach that has delivered uncommon investment outcomes and helped thousands of participants come closer to achieving their financial dreams.
A history of strong results
Our Series has outpaced its peers over the long haul.
-
-
Return rankings
Retirement takes a lifetime to earn. Our Series focuses on building and preserving wealth over the long-term.
Morningstar category percentile return rankings
(with absolute rank and number of funds in category indicated)
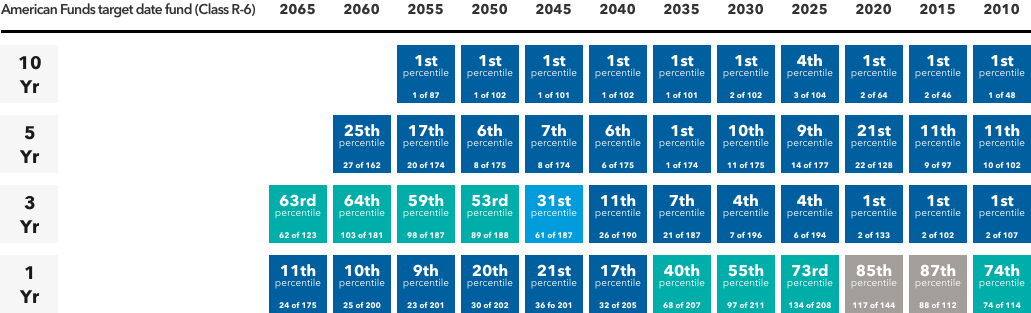

Source: Capital Group, using Morningstar data as of December 31, 2023. Percentile rankings are calculated by Morningstar and reflect relative performance versus peers. A lower number is better: First percentile indicates a fund’s performance was in the top 1% of its peer group.
All funds began on February 1, 2007, except for 2055 (February 1, 2010), 2060 (March 27, 2015) and 2065 (March 27, 2020). Rankings are based on the funds’ average annual total returns (Class R-6 shares at net asset value) within the applicable Morningstar categories and don’t reflect the effects of sales charges, account fees or taxes. Past results are not predictive of results in future periods. Category averages include all share classes for the funds in the category. While American Funds R-6 shares don’t include fees for advisor compensation and service provider payments, the share classes represented in the Morningstar category have varying fee structures and can include these and other fees and charges, resulting in higher expenses and lower returns.
For a list of each fund’s Morningstar category, please see the “Morningstar categories” section. Categories include active, passive and hybrid target date funds, as well as those that are managed both “to” and “through” retirement. Approximately one-third of the funds within the 2000–2010 category have a target date of 2005. In an effort to manage the risk of investors outliving their savings while managing volatility, our approach to allocating between stocks and bonds puts more emphasis on stocks (particularly on dividend-paying stocks) than some other target date funds. Investment results assume all distributions are reinvested and reflect applicable fees and expenses. When applicable, results reflect expense reimbursements, without which they would have been lower.
-
Sharpe ratio rankings**
On a risk-adjusted basis, our Series’ results have been particularly strong thanks to a history of dampening exposure to market swings.
Morningstar category percentile Sharpe ratio rankings
(with absolute rank and number of funds in category indicated)
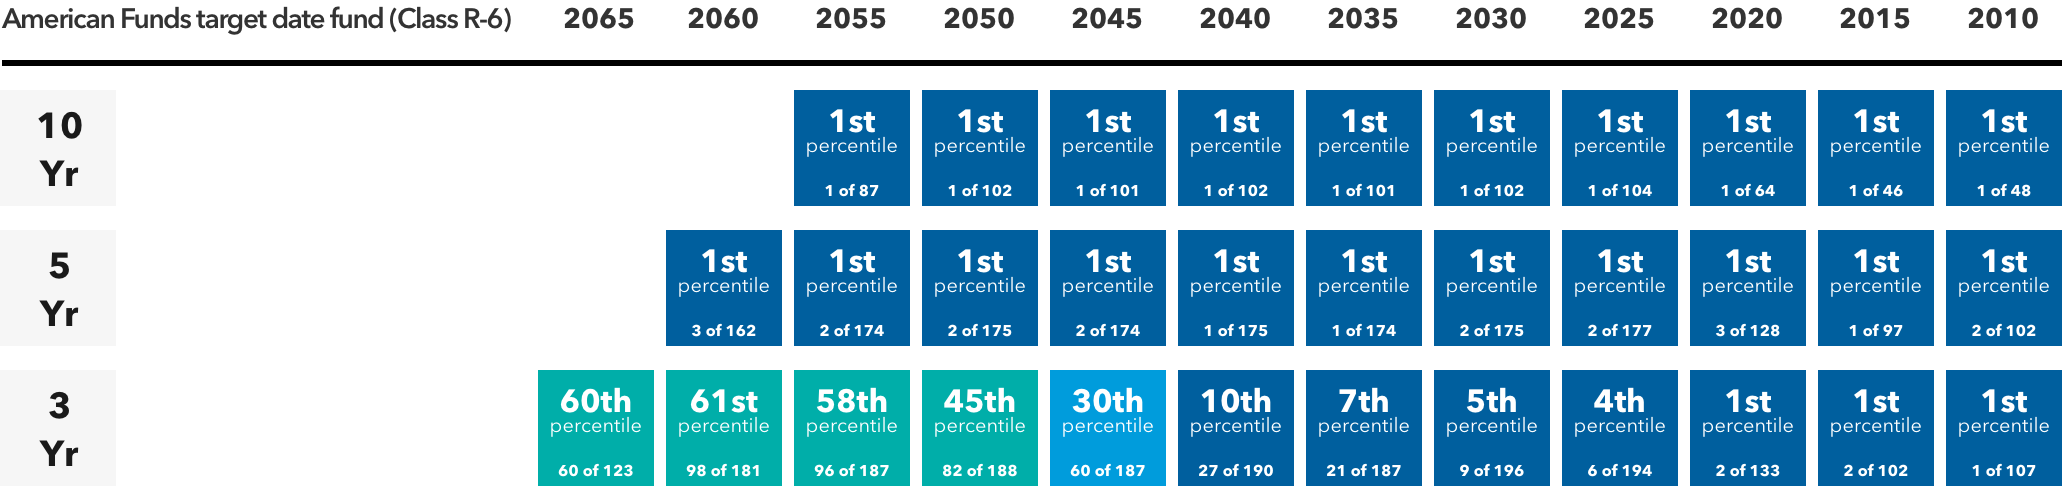
**Sharpe ratio uses standard deviation (a measure of volatility) and returns to determine the reward per unit of risk. The higher the ratio, the better the portfolio’s historical risk-adjusted performance.
Source: Capital Group, using Morningstar data as of December 31, 2023. Percentile rankings are calculated by Morningstar and reflect relative performance versus peers. A lower number is better: First percentile indicates a fund’s performance was in the top 1% of its peer group.All funds began on February 1, 2007, except for 2055 (February 1, 2010), 2060 (March 27, 2015) and 2065 (March 27, 2020). Rankings are based on the funds’ average annual total returns (Class R-6 shares at net asset value) within the applicable Morningstar categories and don’t reflect the effects of sales charges, account fees or taxes. Past results are not predictive of results in future periods. Category averages include all share classes for the funds in the category. While American Funds R-6 shares don’t include fees for advisor compensation and service provider payments, the share classes represented in the Morningstar category have varying fee structures and can include these and other fees and charges, resulting in higher expenses and lower returns.
For a list of each fund’s Morningstar category, please see the “Morningstar categories” section. Categories include active, passive and hybrid target date funds, as well as those that are managed both “to” and “through” retirement. Approximately one-third of the funds within the 2000–2010 category have a target date of 2005. In an effort to manage the risk of investors outliving their savings while managing volatility, our approach to allocating between stocks and bonds puts more emphasis on stocks (particularly on dividend-paying stocks) than some other target date funds. Investment results assume all distributions are reinvested and reflect applicable fees and expenses. When applicable, results reflect expense reimbursements, without which they would have been lower.
-


Recognized for our results.


American Funds was the DC plan provider selected most often as “a company I trust” and “easy for advisors to do business with.”‡
Seeking to build and preserve wealth
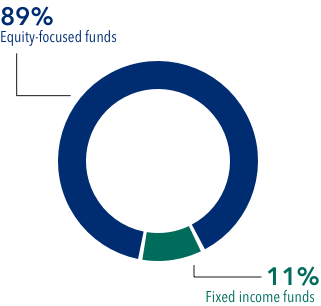
Our Series adapts to changing participant needs by adjusting both its stock/bond mix and the types of assets held through each stage of life.
Our Series adapts to changing participant needs by adjusting both its stock/bond mix and the types of assets held through each stage of life.
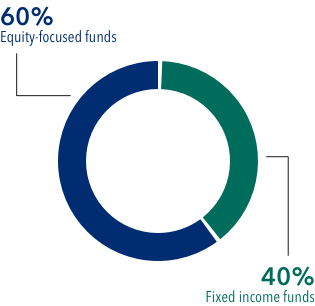
Early career
(roughly 45 to 20 years before retirement)
Seek to grow wealth and manage risk with predominantly growth-oriented equities and a prudent allocation to defensive bonds.
American Funds Target Date Retirement Series glide path approximation
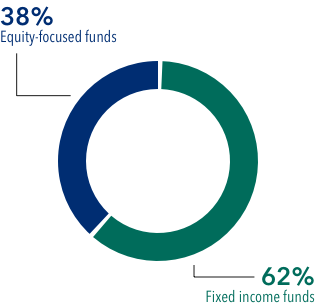
Mid-career
(roughly 20 years before retirement to 5 years after retirement)
Begin to balance growth and income via diversified fixed income and dividend-paying equities.
American Funds Target Date Retirement Series glide path approximation
In retirement
(roughly 5 to 30 years after retirement)
Seek to preserve wealth and deliver sustainable income with less-volatile dividend-paying equities and higher quality bonds.
American Funds Target Date Retirement Series glide path approximation
The target allocations shown are as of December 31, 2023, and are subject to the oversight committee’s discretion. The investment adviser anticipates assets will be invested within a range that deviates no more than 10% above or below the allocations shown in the prospectus/characteristics statement. Underlying funds may be added or removed during the year. Visit capitalgroup.com for current allocations.
The target allocations shown are as of December 31, 2022, and are subject to the oversight committee’s discretion. The investment adviser anticipates assets will be invested within a range that deviates no more than 10% above or below the allocations shown in the prospectus/characteristics statement. Underlying funds may be added or removed during the year. Visit capitalgroup.com for current allocations.
Three factors driving our success
UNDERLYING FUNDS
Solid building blocks
Our funds have delivered peer-beating results and held up well in down markets.
LOW FEES
Delivering value at a low cost
We encourage a focus not just on expenses but on value delivered to participants.
GLIDE PATH
A distinctive approach
Our glide path is different. While our Series changes the mix between stocks and bonds, it also changes the types of assets held. This is designed to better align with participant needs over time.
Making a difference
Our Target Date Solutions Committee, which oversees the Series, brings a diversity of experience and draws on the fundamental research and quantitative resources of the global Capital Group team.
Link a bank account for withdrawals


Years of experience as of December 31, 2023.

Global research offices
About Capital Group
Capital Group has a distinctive, long-term global investment approach that relies on fundamental research. Privately held since its founding in 1931 and with more than $2.5 trillion under management, the firm has more than 479 investment professionals worldwide.*
*As of December 31, 2023.

Global research offices
Global research offices:
Los Angeles |
Geneva |
San Francisco |
Mumbai |
New York |
Hong Kong |
Washington, D.C. |
Tokyo |
Toronto |
Singapore |
London |
|
Compare us to the competition
View our funds
Contact us
Our team is ready to help you help participants.
Important investment disclosures
- Class R-6 shares were first offered on 5/1/2009.
*Source: Kephart, Jason. “American Funds Target Date Retirement Series®,” Morningstar Target-Date Fund Series Report, January 29, 2024.
†Source: Refinitiv Lipper Fund Awards. © 2023 Refinitiv. All rights reserved. Used under license. As of March 24, 2023, 10 vintages in American Funds Target Date Retirement Series received awards in at least one of the three-, five- or 10-year periods for Class R-6 shares. For Class F-3, the 2030 vintage was recognized in the three- and five-year periods and the 2035 vintage was recognized in the five-year period. The Refinitiv Lipper Fund Awards, granted annually, highlight funds and fund companies that have excelled in delivering consistently strong risk-adjusted performance relative to their peers. The Refinitiv Lipper Fund Awards are based on the Lipper Leader for Consistent Return rating, which is a risk-adjusted performance measure calculated over 36, 60 and 120 months. The fund with the highest Lipper Leader for Consistent Return (Effective Return) value in each eligible classification wins the Refinitiv Lipper Fund Award. For more information, see lipperfundawards.com. Although Refinitiv Lipper makes reasonable efforts to ensure the accuracy and reliability of the data contained herein, the accuracy is not guaranteed by Refinitiv Lipper.
‡Source: Escalent, Cogent Syndicated. Retirement Plan Advisor Trends, October 2023. Methodology: 503 respondents participated in a web survey conducted September 8–14, 2023. The respondents consisted of financial advisors managing defined contribution plans. In Ownership of Core Brand Attributes — Tier 1, across the most vital attributes, American Funds was selected most often in response to the question “Which — if any — of these DC plan providers are described by this statement: ‘Is a company I trust?’ and ‘Easy for advisors to do business with’?”
Morningstar categories
American Funds Target Date 2010 |
Morningstar Target Date 2000–2010 |
American Funds Target Date 2015 |
Morningstar Target Date 2015 |
American Funds Target Date 2020 |
Morningstar Target Date 2020 |
American Funds Target Date 2025 |
Morningstar Target Date 2025 |
American Funds Target Date 2030 |
Morningstar Target Date 2030 |
American Funds Target Date 2035 |
Morningstar Target Date 2035 |
American Funds Target Date 2040 |
Morningstar Target Date 2040 |
American Funds Target Date 2045 |
Morningstar Target Date 2045 |
American Funds Target Date 2050 |
Morningstar Target Date 2050 |
American Funds Target Date 2055 |
Morningstar Target Date 2055 |
American Funds Target Date 2060 |
Morningstar Target Date 2060 |
American Funds Target Date 2065 |
Morningstar Target Date 2065+ |
Index definitions
The S&P Target Date Series comprises 12 multi-asset class indexes, each corresponding to a particular target retirement date. Each index provides varying levels of exposure to equities and fixed income. Each target date allocation is created and retired according to a predetermined schedule related to the respective target date.
For quarterly updates of fund allocations, click here.