Demographics & Culture
Categories
Inflation
Why we think the Fed is still behind the curve
 Ritchie Tuazon
 Tim Ng
 Tom Hollenberg
March 16, 2022
The U.S. Federal Reserve raised the federal funds target rate by 25 basis points to a range of 0.25% to 0.50%, marking the start of what is expected to be a forceful path of monetary tightening. The central bank faces the challenge of taming inflation even as a commodities shock in the wake of Russia’s invasion of Ukraine dampens the outlook for global growth.
Fed chairman Jerome Powell reinforced in his comments that the central bank’s primary goal is to tamp down inflation – which is running at a 40-year high – and that it will do what it takes to bring it closer to target. The central bank chief also talked positively about growth and the labour market. “All signs are that this is a strong economy,” Powell said. “Indeed, one that will be able to flourish … in the face of less accommodative monetary policy.”
We maintain our view that inflation will remain elevated and that monetary policy is behind the curve. Markets are pricing in about seven 25-basis-point rate increases in 2022. Powell seems confident that the U.S. economy can withstand higher rates, and so barring a major fundamental shock, we expect the Fed will continue on its tightening path for the rest of 2022. He left open the possibility of a 50-basis-point hike but did not specify what might trigger such a move.
Powell emphasized that he wants to see the month-over-month inflation numbers come down. The Fed is increasingly concerned about inflation becoming unmanageable, and its latest projections indicate it may move rates above its estimated long-term neutral rate of 2.4% by next year. The neutral rate is a theoretical federal funds rate at which monetary policy is considered neither accommodative nor restrictive.
Consistent with this view, we favour positioning bond portfolios for tighter financial conditions by maintaining a short duration focused on two-year maturities. We expect the Treasury yield curve to flatten further, led by a rise in shorter maturities while long-term interest rates remain in a range.
We also anticipate quantitative tightening (QT) plans could be unveiled in May and begin in June following another rate increase at the Fed’s May meeting. The central bank will likely shrink its balance sheet by not replacing maturing bonds. While actively selling securities is a possibility, it is not its preferred path.
Peak fed funds rate has declined with each successive hiking cycle
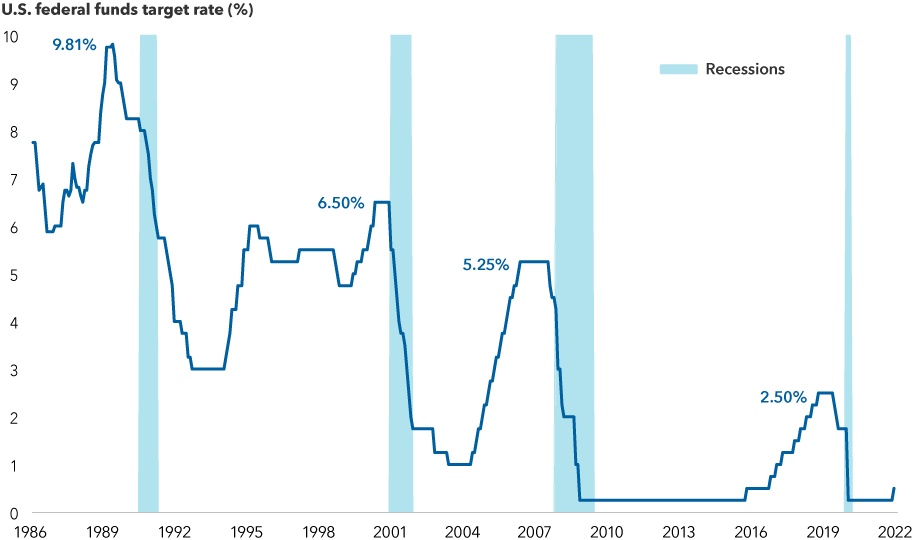
Sources: Capital Group, Federal Reserve Bank of St. Louis, National Bureau of Economic Research. As of January 31, 2022.
Tight labour markets complicate inflation picture
The Fed remains focused on fighting inflation despite a dampened growth outlook given the war in Ukraine. Inflation rose sharply in February with headline and core metrics accelerating to 7.9% and 6.4% year-over-year, respectively. We continue to see broadening price pressures across major categories, and we see a 50% chance that the U.S. CPI will accelerate in the coming months. In shelter, the largest component of the Consumer Price Index, prices have increased 4.8% year-over-year, the fastest pace since the early 1990s. Even if you strip out shelter and other high-inflation categories, the CPI remains elevated and on an upward trend.
Inflation is being driven higher by several components
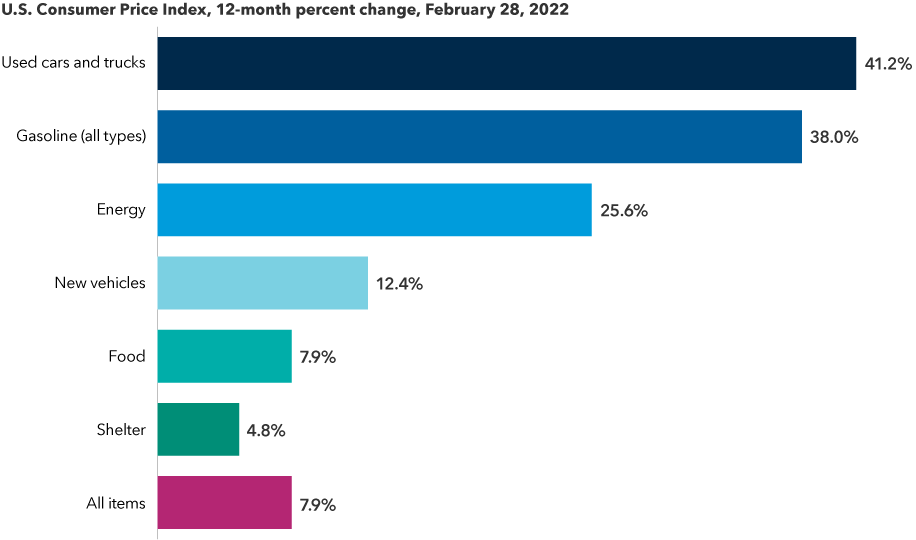
Sources: Capital Group, U.S. Bureau of Labor Statistics. As of February 28, 2022. Based in USD.
The surge in commodity prices — spanning energy, metals, raw materials and agricultural products — will also feed into inflation. The Bloomberg Commodity Index doubled in the past two years, an increase not seen since the early 1980s. The greatest impact is likely to be felt by lower income consumers as food and gas make up a large percentage of their spending.
With supply chain issues likely to remain troublesome and the war creating upside risks to food and energy prices, market participants are pricing rising inflation risk premia (a measure of the premium investors require for the possibility that inflation may rise or fall more than expected over the period in which a bond is held) into bonds. Breakeven inflation on five-year U.S. Treasury Inflation-Protected Securities (TIPS) has risen from 3.0% to around 3.5% this year, the highest reading since the launch of the asset class.
Wage growth and a variety of other indicators point to ongoing pressure in the labour market, which Powell said Wednesday had reached an “unhealthy level” of tightness. In February, the U.S. added 678,000 jobs, bringing unemployment down to 3.8%. The labour force participation rate rebounded to 62.3% in February, its highest level since March 2020, indicating there are going to be fewer workers on the sidelines. We are also seeing historically elevated quit rates, signaling that workers have confidence in their ability to find other employment — often with better pay. Average hourly earnings stagnated between January and February but remain up 5.1% over the past 12 months.
We believe the Fed’s most likely plan will be to move steadily toward restrictive policy with consecutive 25-basis-point hikes until policy rates are at or slightly above neutral. However, we are not ruling out the possibility that the central bank will move in a more forceful, Paul Volcker-esque manner. (In 1981, then-Fed Chairman Volcker sharply raised rates to contain runaway inflation.)
In terms of societal impact, the Fed faces tough choices. If the Fed remains dovish, allowing inflation to run unchecked, food and energy prices would be among the most likely to accelerate. If it tightens aggressively and stymies growth, unemployment would likely move up and wage increases would be curtailed.
Global overview
The Fed is not alone in its path. Major central banks in Europe and the Bank of Canada have signaled a more hawkish stance in recent weeks as inflation continues to outpace their targets.
The European Central Bank delivered a hawkish message at its March meeting, laying out plans to end its asset purchase program by the third quarter of this year and, in the process, paving the way for a potential rate hike.
Despite the downside risks to growth stemming from the war in Ukraine, ECB President Christine Lagarde focused her remarks on the upside risks to inflation and stressed “optionality and flexibility” in the governing council’s policy stance. The front-end of the euro curve is pricing in roughly 30 basis points of hikes by year-end.
Meanwhile, the Bank of England raised interest rates by 25 basis points March 17, bringing the cost of borrowing to 0.75%. This follows the 25-basis-points hike and initiation of passive QT announced in February. In Canada, the central bank raised its policy rate 25 basis points at its March 2 meeting bringing it to 0.50%. Canada’s headline inflation rate hit 5.7% in February from a year earlier, the highest since 1991, and well above its target range of 1% to 3%. All in all, these actions should lead to tighter financial conditions in most of the major developed economies.
Against this backdrop, we maintain a defensive posture in our fixed income portfolios. In U.S. core bond portfolios, in addition to a short duration and positioning for a flattening of the yield curve, we also favour a slight relative underweight to credit. Meanwhile, TIPS prices largely reflect inflationary expectations, so managers are more opportunistic based on where they see value along the maturity spectrum.
In many equity portfolios, depending on investment objectives and mandate, we are starting to see managers selectively add to investments in energy, materials, mining companies, consumer staples and other consumer-related companies with a degree of pricing power.
Learn more about
Timothy Ng is a portfolio manager for Capital Group Canadian Core Plus Fixed Income Fund (Canada).
Bloomberg Commodity Index reflects commodity futures price movements. It is calculated on an excess return basis.
U.S. Consumer Price Index (CPI) is a measure of the average change over time in the prices paid by U.S. urban consumers for a market basket of consumer goods and services.
Our latest insights
-
-
-
Emerging Markets
-
Long-Term Investing
-
RELATED INSIGHTS
-
Long-Term Investing
-
Demographics & Culture
-
Long-Term Investing
Commissions, trailing commissions, management fees and expenses all may be associated with mutual fund investments. Please read the prospectus before investing. Mutual funds are not guaranteed, their values change frequently and past performance may not be repeated.
Unless otherwise indicated, the investment professionals featured do not manage Capital Group‘s Canadian mutual funds.
References to particular companies or securities, if any, are included for informational or illustrative purposes only and should not be considered as an endorsement by Capital Group. Views expressed regarding a particular company, security, industry or market sector should not be considered an indication of trading intent of any investment funds or current holdings of any investment funds. These views should not be considered as investment advice nor should they be considered a recommendation to buy or sell.
Statements attributed to an individual represent the opinions of that individual as of the date published and do not necessarily reflect the opinions of Capital Group or its affiliates. This information is intended to highlight issues and not be comprehensive or to provide advice. For informational purposes only; not intended to provide tax, legal or financial advice. We assume no liability for any inaccurate, delayed or incomplete information, nor for any actions taken in reliance thereon. The information contained herein has been supplied without verification by us and may be subject to change. Capital Group funds are available in Canada through registered dealers. For more information, please consult your financial and tax advisors for your individual situation.
Forward-looking statements are not guarantees of future performance, and actual events and results could differ materially from those expressed or implied in any forward-looking statements made herein. We encourage you to consider these and other factors carefully before making any investment decisions and we urge you to avoid placing undue reliance on forward-looking statements.
The S&P 500 Composite Index (“Index”) is a product of S&P Dow Jones Indices LLC and/or its affiliates and has been licensed for use by Capital Group. Copyright © 2024 S&P Dow Jones Indices LLC, a division of S&P Global, and/or its affiliates. All rights reserved. Redistribution or reproduction in whole or in part are prohibited without written permission of S&P Dow Jones Indices LLC.
FTSE source: London Stock Exchange Group plc and its group undertakings (collectively, the "LSE Group"). © LSE Group 2024. FTSE Russell is a trading name of certain of the LSE Group companies. "FTSE®" is a trade mark of the relevant LSE Group companies and is used by any other LSE Group company under licence. All rights in the FTSE Russell indices or data vest in the relevant LSE Group company which owns the index or the data. Neither LSE Group nor its licensors accept any liability for any errors or omissions in the indices or data and no party may rely on any indices or data contained in this communication. No further distribution of data from the LSE Group is permitted without the relevant LSE Group company's express written consent. The LSE Group does not promote, sponsor or endorse the content of this communication. The index is unmanaged and cannot be invested in directly.
BLOOMBERG® is a trademark and service mark of Bloomberg Finance L.P. and its affiliates (collectively “Bloomberg”). Bloomberg or Bloomberg’s licensors own all proprietary rights in the Bloomberg Indices. Neither Bloomberg nor Bloomberg’s licensors approves or endorses this material, or guarantees the accuracy or completeness of any information herein, or makes any warranty, express or implied, as to the results to be obtained therefrom and, to the maximum extent allowed by law, neither shall have any liability or responsibility for injury or damages arising in connection therewith.
MSCI does not approve, review or produce reports published on this site, makes no express or implied warranties or representations and is not liable whatsoever for any data represented. You may not redistribute MSCI data or use it as a basis for other indices or investment products.
Capital believes the software and information from FactSet to be reliable. However, Capital cannot be responsible for inaccuracies, incomplete information or updating of the information furnished by FactSet. The information provided in this report is meant to give you an approximate account of the fund/manager's characteristics for the specified date. This information is not indicative of future Capital investment decisions and is not used as part of our investment decision-making process.
Indices are unmanaged and cannot be invested in directly. Returns represent past performance, are not a guarantee of future performance, and are not indicative of any specific investment.
All Capital Group trademarks are owned by The Capital Group Companies, Inc. or an affiliated company in Canada, the U.S. and other countries. All other company names mentioned are the property of their respective companies.
Capital Group funds are offered in Canada by Capital International Asset Management (Canada), Inc., part of Capital Group, a global investment management firm originating in Los Angeles, California in 1931. Capital Group manages equity assets through three investment groups. These groups make investment and proxy voting decisions independently. Fixed income investment professionals provide fixed income research and investment management across the Capital organization; however, for securities with equity characteristics, they act solely on behalf of one of the three equity investment groups.
The Capital Group funds offered on this website are available only to Canadian residents.