Global Equities
Categories
China
China: What could drive its markets in 2023
 Victor Kohn
 Steve Watson
 Kent Chan
January 31, 2023
As nearly three years of lockdowns come to an end in China, will 2023 be a turning point for equity investors?
Without a doubt, China’s equity risk premium is higher than other markets. As investment professionals with more than 25 years of experience investing in China, we believe the higher premium is due to the government’s repeated intervention and influence in the economy and markets, as well as geopolitical uncertainty. We also recognize that China’s economic recovery could be uneven and trade-related tensions with the U.S. will likely persist.
However, China’s equities markets have been rallying this year on the country’s abrupt departure from strict COVID policies. Some sectors have been buoyed by more supportive measures for the property market and encouraging regulatory developments for technology companies. We’ve learned from experience that volatility can mask buying opportunities in China. We believe this could be one of those times, particularly for select companies well-positioned for an economic rebound, but also for those that remain aligned with the Common Prosperity goals of the administration.
Here are a few themes to consider for investing in China and why we are constructive:
1. Reopening could be a positive catalyst for valuations
China’s departure from its zero-COVID policy removes a headwind to stocks and could be a catalyst for a positive rerating of Chinese equities. The MSCI China Index has already surged more than 50% (as of January 23) after reaching a multiyear low October 31, 2022, and we believe it has more room to run. Valuations for almost all sectors are still trading below their 10-year average on a consensus price-to-earnings (P/E) basis for the next 12 months. We don’t anticipate the market will rally indefinitely, but we sense downside risks have lessened, given that sentiment had become so dire since 2021.
The ability for people to move more freely should trigger a change in consumer behaviour and lead to a recovery in domestic consumption. Beneficiaries of this shift will likely be hotel companies, online travel firms, airport operators and luxury goods makers. Airports are busy again as people seek to travel inside and outside the country. There’s been a surge in hotel bookings in China’s larger cities, and consumers are flocking back to shopping malls.
Many sectors trade at steep discounts
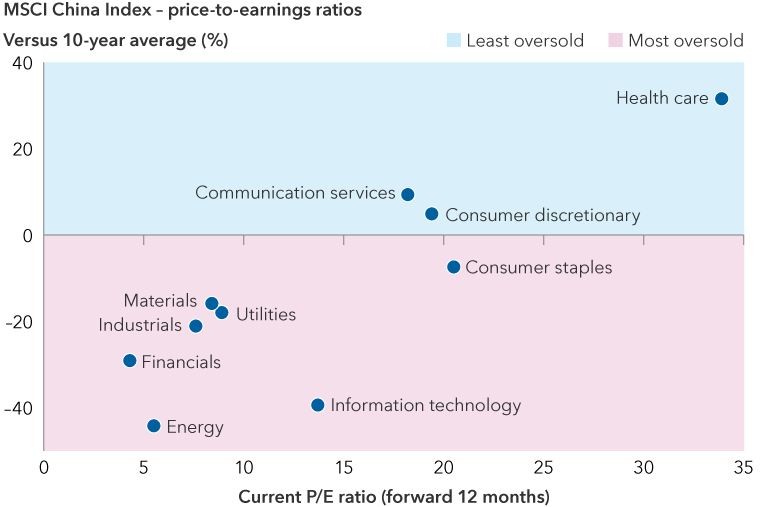
Sources: MSCI, RIMES. Forward price-to-earnings ratio reflects the current share price relative to the consensus estimate for earnings per share on a forward 12-month basis. Data as of November 30, 2022.
Increased mobility may also benefit certain financial services providers whose sales agents rely on face-to-face meetings to drive new business. Casino operators in Macau, where travel is opening up after heavy restrictions, could benefit too.
We think a cyclical recovery could boost the outlook for China’s larger banks, which on a P/E basis currently trade for three or four times consensus earnings expectations for the next 12 months. Valuations for Chinese banks have been depressed for many years. But they compressed further in 2022 on China’s weak growth and liquidity crunch in the property market.
2. Government is committed to stabilizing the property market
As part of its message that “housing is for living, not for speculation,” Beijing has sought to contain the rapid appreciation in residential property prices and reduce excess leverage. However, its various policy decisions have not always had the intended outcome. Many property developers are struggling financially, some have defaulted on debt payments, and homebuyers have become more cautious.
Recent actions have made it clear that the government recognizes it has to fix the property sector, which represents about 25% of GDP and roughly 60% of household balance sheets. Authorities have provided hundreds of billions of dollars to help complete unfinished projects, loosened down-payment requirements and lowered mortgage rates. These measures, among others, should help restore consumer confidence and minimize bankruptcies. We think government leaders have little choice but to keep introducing new polices to bolster the property market until they can rectify the situation.
Homebuying in China has slumped
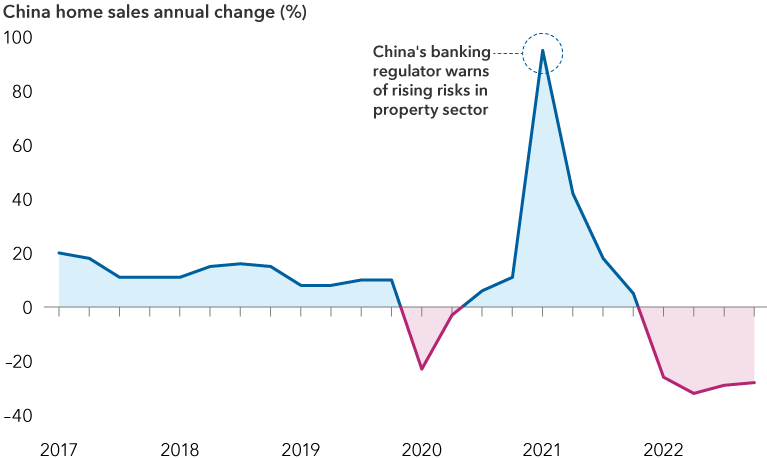
Source: Capital Group, National Bureau of Statistics of China, Refinitiv Datastream. China home sales above are represented by the quarterly sales volume of commercial residential buildings in current prices. As of December 31, 2022.
After what is likely to be wave of consolidation and limitations on development, the property market will likely become a smaller part of the economy longer term. It should also be operated more sensibly and far less on speculation. Volume growth will likely be more measured and selling prices more constrained to make housing more affordable. This could be an opportunity for higher quality developers who have maintained stronger balance sheets to gain market share and consolidate their leadership positions.
3. Regulatory fog is clearing over China’s tech sector
The most stringent policy measures to curb overreach in China’s technology sector may be behind us. These were aimed at controlling excesses in the private economy and curbing monopolistic behaviour. Moving forward, it’s clear growth for technology companies will be more constrained due to regulation but also because the industry has matured.
Valuations for internet-related companies remain depressed by historical standards. The downside seems more limited now assuming conservative earnings growth. But we do not expect a significant rerating for these companies, because revenue growth rates probably won’t reach 30% to 40% again.
On the upside, the regulatory environment appears to be improving. For example, Tencent and NetEase have received long-awaited approvals for new video game licenses. Ant Group, whose high-profile initial public offering was halted in 2020, was recently allowed to start raising capital from new investors.
Government regulators reportedly plan to take special 1% equity stakes (known as “golden shares”) in units of Tencent and Alibaba, similar to those taken at TikTok owner ByteDance and Weibo, China’s version of Twitter. We think this signals that Beijing’s rectification process is nearing an end.
How much risk is priced in? Tech valuations have compressed
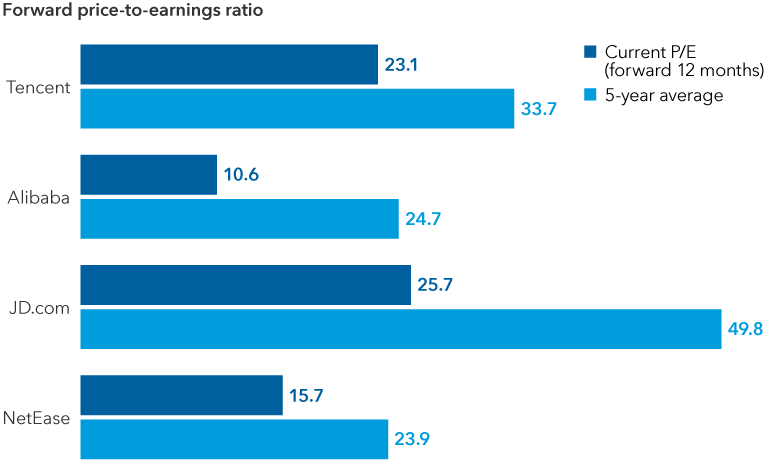
MSCI, RIMES. Forward price-to-earnings ratio reflects the current share price relative to the consensus estimate for earnings per share on a forward 12-month basis. Data as of November 30, 2022.
China’s internet giants have narrowed their business focus and adjusted their cost structures by exiting business lines and laying off employees. They’ve also made a massive shift in expansion and growth strategies. Instead of seeking out large-scale acquisitions, they have divested from equity stakes in other tech firms and used excess cash to buy back shares or pay special dividends to shareholders.
We believe that innovation will also continue to drive growth. China’s video game platforms, payment systems and e-commerce have been areas of tremendous innovation over the past decade, and this should continue to drive growth. As many companies find a new rhythm in the evolved regulatory regime, we expect new technologies to be new sources of revenues and earnings.
4. Beijing needs more growth to support policy agenda
It’s our belief that China wants a growing and dynamic economy characterized by a significant degree of innovation. We believe Communist Party leaders know this cannot be accomplished by state-owned businesses alone and that private enterprise is needed to achieve long-term economic goals.
China’s equity risk premium (an excess return that investing in stocks can provide over a risk-free rate typically represented by Treasuries) is higher than other markets, but there are reasons to consider investing: China is a large domestic market. Its population is getting older and wealthier, creating the need for a better health care system and a wide range of consumer and financial services. Swings in market sentiment have not changed these realities in our view.
China’s biopharmaceutical industry, which is closely aligned with the government’s domestic policy agenda, is a longer term potential opportunity with a long runway for growth. Several well-capitalized companies are developing innovative drugs that have the potential to be sold around the world. Multinationals have also partnered with Chinese firms such as BeiGene and Innovent to develop new drugs and sell them in China’s large market.
China also wants to bolster its manufacturing prowess and retain dominance in certain areas of the global supply chain, such as electric vehicles (EVs). China has become a global leader in battery development, a key supplier of other materials and a large EV manufacturer in its own right.
Stock picking in China has been crucial over the past decade
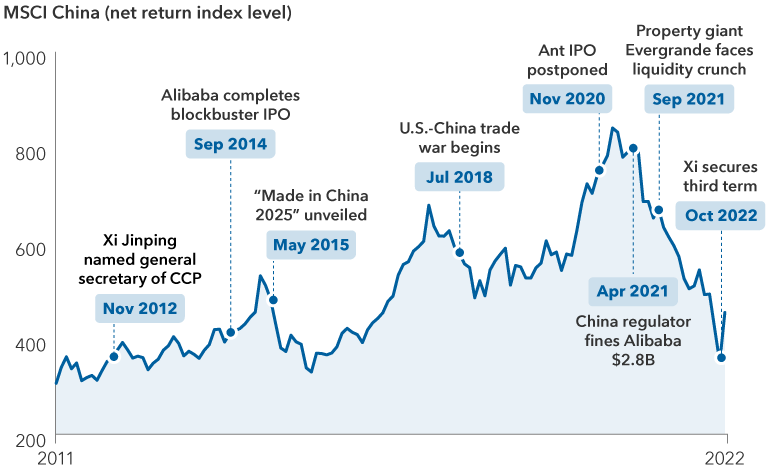
MSCI, RIMES. Data reflects price level on net basis. As of December 31, 2022.
5. A reset in U.S-China relations
There have been steps in the right direction to help reset relations between the U.S. and China, which could help alleviate pressure on Chinese assets.
Presidents Joe Biden and Xi Jinping held constructive talks at November’s G-20 meeting. U.S. audit regulators were granted deeper access to inspect the books of Chinese companies that trade on U.S. stock exchanges, helping ease concerns that the companies could be delisted. Chinese biopharmaceutical companies were also removed from the U.S. Commerce Department’s unverified list regarding access to facility inspections.
Of course, China’s strategy and approach to Taiwan remain the biggest unknown and risk.
Overall direction looking more positive
We think we are past the point of peak pessimism on China. The reopening of the economy will be a catalyst to stimulate domestic consumption, which should provide a boost to many other areas, even though the overall nominal GDP growth rate may remain muted. From our experience investing in China, the bull phase is not as strong as investor enthusiasm, and the bottom is not as deep as investors fear.
No doubt there will be ongoing geopolitical and economic uncertainties, but as the world’s second largest economy reopens, we also see many investment opportunities. Companies tapping into travel, entertainment, higher quality goods, better health care, technology innovation and renewable energy could be long-term beneficiaries. Current valuations provide good entry points for many of them. But in China as much as in any market, fundamental research and a deep knowledge of companies are a must for successful investing and determining the appropriate level of exposure.
Learn more about
Steve Watson is a portfolio manager on Capital Group Capital Income Builder (Canada) and Capital Group Monthly Income Portfolio (Canada).
The MSCI China Index captures large and mid cap representation across China A shares, H shares, B shares, Red chips, P chips and foreign listings (e.g. ADRs). With 714 constituents, the index covers about 85% of this China equity universe.
Get the 2023 Outlook report
Our latest insights
-
-
Technology & Innovation
-
Demographics & Culture
-
-
Emerging Markets
RELATED INSIGHTS
-
Technology & Innovation
-
Long-Term Investing
-
Demographics & Culture
Commissions, trailing commissions, management fees and expenses all may be associated with mutual fund investments. Please read the prospectus before investing. Mutual funds are not guaranteed, their values change frequently and past performance may not be repeated.
Unless otherwise indicated, the investment professionals featured do not manage Capital Group‘s Canadian mutual funds.
References to particular companies or securities, if any, are included for informational or illustrative purposes only and should not be considered as an endorsement by Capital Group. Views expressed regarding a particular company, security, industry or market sector should not be considered an indication of trading intent of any investment funds or current holdings of any investment funds. These views should not be considered as investment advice nor should they be considered a recommendation to buy or sell.
Statements attributed to an individual represent the opinions of that individual as of the date published and do not necessarily reflect the opinions of Capital Group or its affiliates. This information is intended to highlight issues and not be comprehensive or to provide advice. For informational purposes only; not intended to provide tax, legal or financial advice. We assume no liability for any inaccurate, delayed or incomplete information, nor for any actions taken in reliance thereon. The information contained herein has been supplied without verification by us and may be subject to change. Capital Group funds are available in Canada through registered dealers. For more information, please consult your financial and tax advisors for your individual situation.
Forward-looking statements are not guarantees of future performance, and actual events and results could differ materially from those expressed or implied in any forward-looking statements made herein. We encourage you to consider these and other factors carefully before making any investment decisions and we urge you to avoid placing undue reliance on forward-looking statements.
The S&P 500 Composite Index (“Index”) is a product of S&P Dow Jones Indices LLC and/or its affiliates and has been licensed for use by Capital Group. Copyright © 2024 S&P Dow Jones Indices LLC, a division of S&P Global, and/or its affiliates. All rights reserved. Redistribution or reproduction in whole or in part are prohibited without written permission of S&P Dow Jones Indices LLC.
FTSE source: London Stock Exchange Group plc and its group undertakings (collectively, the "LSE Group"). © LSE Group 2024. FTSE Russell is a trading name of certain of the LSE Group companies. "FTSE®" is a trade mark of the relevant LSE Group companies and is used by any other LSE Group company under licence. All rights in the FTSE Russell indices or data vest in the relevant LSE Group company which owns the index or the data. Neither LSE Group nor its licensors accept any liability for any errors or omissions in the indices or data and no party may rely on any indices or data contained in this communication. No further distribution of data from the LSE Group is permitted without the relevant LSE Group company's express written consent. The LSE Group does not promote, sponsor or endorse the content of this communication. The index is unmanaged and cannot be invested in directly.
BLOOMBERG® is a trademark and service mark of Bloomberg Finance L.P. and its affiliates (collectively “Bloomberg”). Bloomberg or Bloomberg’s licensors own all proprietary rights in the Bloomberg Indices. Neither Bloomberg nor Bloomberg’s licensors approves or endorses this material, or guarantees the accuracy or completeness of any information herein, or makes any warranty, express or implied, as to the results to be obtained therefrom and, to the maximum extent allowed by law, neither shall have any liability or responsibility for injury or damages arising in connection therewith.
MSCI does not approve, review or produce reports published on this site, makes no express or implied warranties or representations and is not liable whatsoever for any data represented. You may not redistribute MSCI data or use it as a basis for other indices or investment products.
Capital believes the software and information from FactSet to be reliable. However, Capital cannot be responsible for inaccuracies, incomplete information or updating of the information furnished by FactSet. The information provided in this report is meant to give you an approximate account of the fund/manager's characteristics for the specified date. This information is not indicative of future Capital investment decisions and is not used as part of our investment decision-making process.
Indices are unmanaged and cannot be invested in directly. Returns represent past performance, are not a guarantee of future performance, and are not indicative of any specific investment.
All Capital Group trademarks are owned by The Capital Group Companies, Inc. or an affiliated company in Canada, the U.S. and other countries. All other company names mentioned are the property of their respective companies.
Capital Group funds are offered in Canada by Capital International Asset Management (Canada), Inc., part of Capital Group, a global investment management firm originating in Los Angeles, California in 1931. Capital Group manages equity assets through three investment groups. These groups make investment and proxy voting decisions independently. Fixed income investment professionals provide fixed income research and investment management across the Capital organization; however, for securities with equity characteristics, they act solely on behalf of one of the three equity investment groups.
The Capital Group funds offered on this website are available only to Canadian residents.