
FACTORS DRIVING OUR SUCCESS
It’s about more than fees
All target date providers make crucial investment decisions that impact participant outcomes. So the focus should be on the benefit, not just the cost.
No target date fund is truly passive
The table below shows a selection of underlying investment decisions made by target date providers. Even passive providers make active asset allocation decisions.
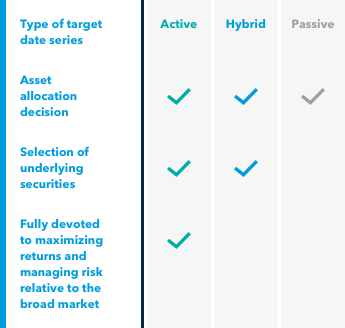
Type of target date series
Asset allocation decision
Selection of underlying securities
Fully devoted to maximizing returns and managing risk relative to the broad market
Active
Hybrid
Passive
Source: Capital Group. Target date types based on methodology from Morningstar, which uses the percentage of a series’ assets in underlying active strategies to classify each series as active (80% to 100% actively managed), hybrid (20% to 80% actively managed) or passive (less than 20% actively managed). Blank fields indicate the source of returns isn't applicable to that type of target date series.
Giving participants more, for less
Expense ratios for target date series vary significantly, but our Series stands out as one of the cheapest despite using 100% active underlying funds — undercutting hybrid providers that mix passive and active funds.
Average annual expense ratio of 51 target date series

Source: Capital Group, using data obtained from Morningstar. As of December 31, 2022. Data shown is of the lowest cost mutual fund share class for each peer target date series. Average expense ratio shown is a straight average of expenses of all vintages of the lowest cost share class available as of December 31, 2021. The percentage of a series’ assets in underlying active strategies (as calculated by Morningstar) was used to classify each series as active (80% to 100% actively managed), hybrid (20% to 80%) or passive (less than 20%). The active category contained 17 series, hybrid contained 20 series, and passive contained 14 series.
Compare outcomes, not just fees
American Funds Target Date Series vintages have delivered superior outcomes compared to large passive peers with additional returns that, on average, have exceeded the additional cost. The charts below illustrate the range of higher returns and additional expenses by vintage.
-
-
The benefit
Our Series has delivered 1.1% in additional annual return on average across its vintages vs. its largest passive peers.
Range of AFTD’s 10-year excess return difference versus largest passive peers (annualized after fees)
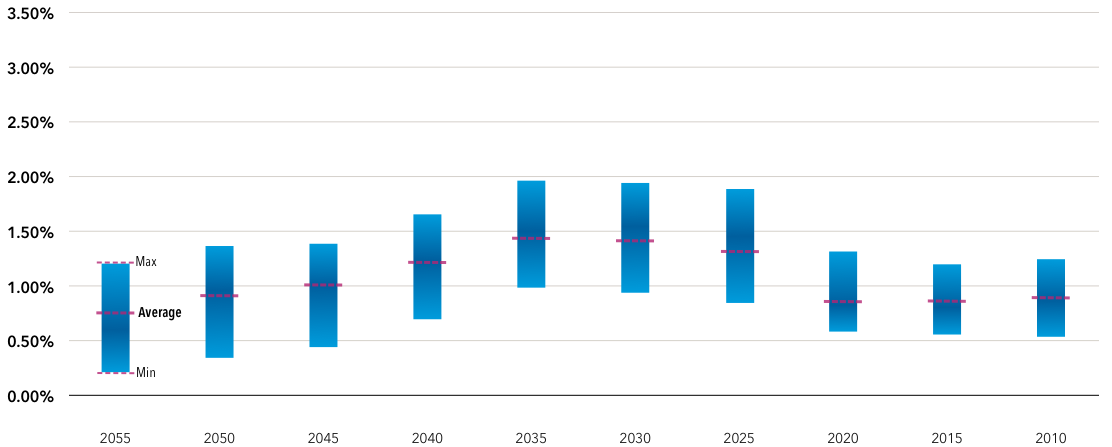
Source: Capital Group, using data obtained from Morningstar. As of December 31, 2022. Data for American Funds is Class R-6 shares and of the lowest cost share class with sufficient track record for each peer target date series.
Exhibit methodology
Each vintage within American Funds Target Date Retirement Series was compared to existing vintages in the same Morningstar category. Excess return represents annualized excess return over the period of 10 years ending December 31, 2022; results in other periods differ. Analysis includes the five largest passive series based on mutual fund AUM as of November 30, 2022, with 10-year track record and ranged from $4.3 billion to $543.6 billion, representing 98% of passively managed target date series mutual fund market AUM and 49% of all target date series mutual fund market AUM. Passive series defined as those with less than 20% of assets in active strategies. Fee difference based on expense ratios as of January 1, 2023.
-
The cost
Yet, our Series on average costs just 0.24% more per year than its largest passive peers.
Range of AFTD’s additional annual expense vs. largest passive peers
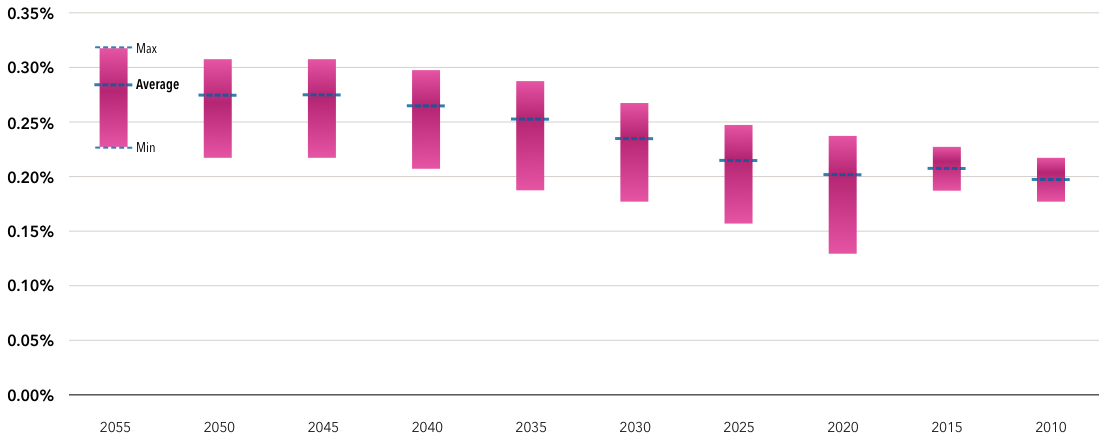
Source: Capital Group, using data obtained from Morningstar. As of December 31, 2022. Data for American Funds is Class R-6 shares and of the lowest cost share class with sufficient track record for each peer target date series.
Exhibit methodology
Each vintage within American Funds Target Date Retirement Series was compared to existing vintages in the same Morningstar category. Excess return represents annualized excess return over the period of 10 years ending December 31, 2022; results in other periods differ. Analysis includes the five largest passive series based on mutual fund AUM as of November 30, 2022, with 10-year track record and ranged from $4.3 billion to $543.6 billion, representing 98% of passively managed target date series mutual fund market AUM and 49% of all target date series mutual fund market AUM. Passive series defined as those with less than 20% of assets in active strategies. Fee difference based on expense ratios as of January 1, 2023.
-


UNDERLYING FUNDS
Solid building blocks
Our funds have delivered peer-beating results and held up well in down markets.
GLIDE PATH
A distinctive approach
Our glide path is different. While our Series changes the mix between stocks and bonds, it also changes the types of assets held. This is designed to better align with participant needs over time.
HOMEPAGE
Discover what sets our Series apart
Target date funds have a lot in common. But the American Funds Target Date Series takes a distinctive approach that has delivered uncommon investment outcomes and helped thousands of participants come closer to achieving their financial goals.
Compare us to the competition
View our funds
Contact us
Our team is ready to help you help participants.
Important investment disclosures
Certain share classes were offered after the inception dates of some funds. Results for these shares prior to the dates of first sale are hypothetical based on the original share class results without a sales charge, adjusted for typical estimated expenses.
- Class R-6 shares were first offered on 5/1/2009.
Results for certain funds with an inception date after the share class inception also include hypothetical returns because those funds' shares sold after the funds' date of first offering. View dates of first sale and specific expense adjustment information.