Technology & Innovation
Categories
Monetary Policy
Help wanted: How a distorted U.S. job market may foil the U.S. Federal Reserve
 Jared Franz
November 17, 2021
Much has been said and written about rising inflation and how it might influence the U.S. Federal Reserve’s monetary policy. A 30-year high in the U.S. consumer price index in October is only fueling expectations that the Fed will raise interest rates in earnest beginning next year.
But what about the labour market? Given the U.S. central bank’s dual mandate to promote “maximum employment” along with “stable prices and moderate long-term interest rates,” it would be hard to gauge the pace of monetary policy tightening without a clear picture of the many disruptions affecting U.S. workers and employers.
It’s striking how much has changed in the U.S. labour market. Prior to the pandemic, the unemployment rate sat at a 50-year low of 3.5% and wage growth was stable. Now the market is rife with mismatches between labour supply and demand. The unemployment rate has declined considerably from double-digit levels in the early months of the pandemic, but job openings have soared to a record high, above 10 million. The so-called Great Resignation has seen millions of people leave their jobs, and the labour force participation rate sits at 1970s levels. Also, wages are marching higher. This is not the labour market the Fed expected to see 18 months after the COVID-19 recession ended in April 2020.
The key question is whether these are temporary dislocations that will subside as the pandemic wanes, or evidence of a lasting shift in the U.S. labour market.
In my view, COVID-19's impact on labour markets is more structural than cyclical. Many companies that have survived the pandemic on reduced staff are likely leaner, meaner and more efficient. They are unlikely to need the same employment levels they had in February 2020. Likewise, from a labour point of view, many workers do not want the jobs they had before the pandemic. They are taking this opportunity to reassess careers, work-life balance and the need for flexibility. These changes, both cyclical and structural, will weigh on Fed policymakers’ decisions in the months ahead and present a difficult policy choice: raise interest rates to reduce inflation or keep rates low to support full employment.
Temporary mismatches could be resolved soon
To be sure, there are cyclical aspects to the labour market. So, as the pandemic wanes, I expect employment to return to more typical levels in the sectors that were hardest hit by pandemic-related disruptions. Similarly, people who are out of work due to a lack of dependable child care, or who are pursuing education or retraining, could return relatively soon.
Most U.S. job openings are in four COVID-19–impacted sectors
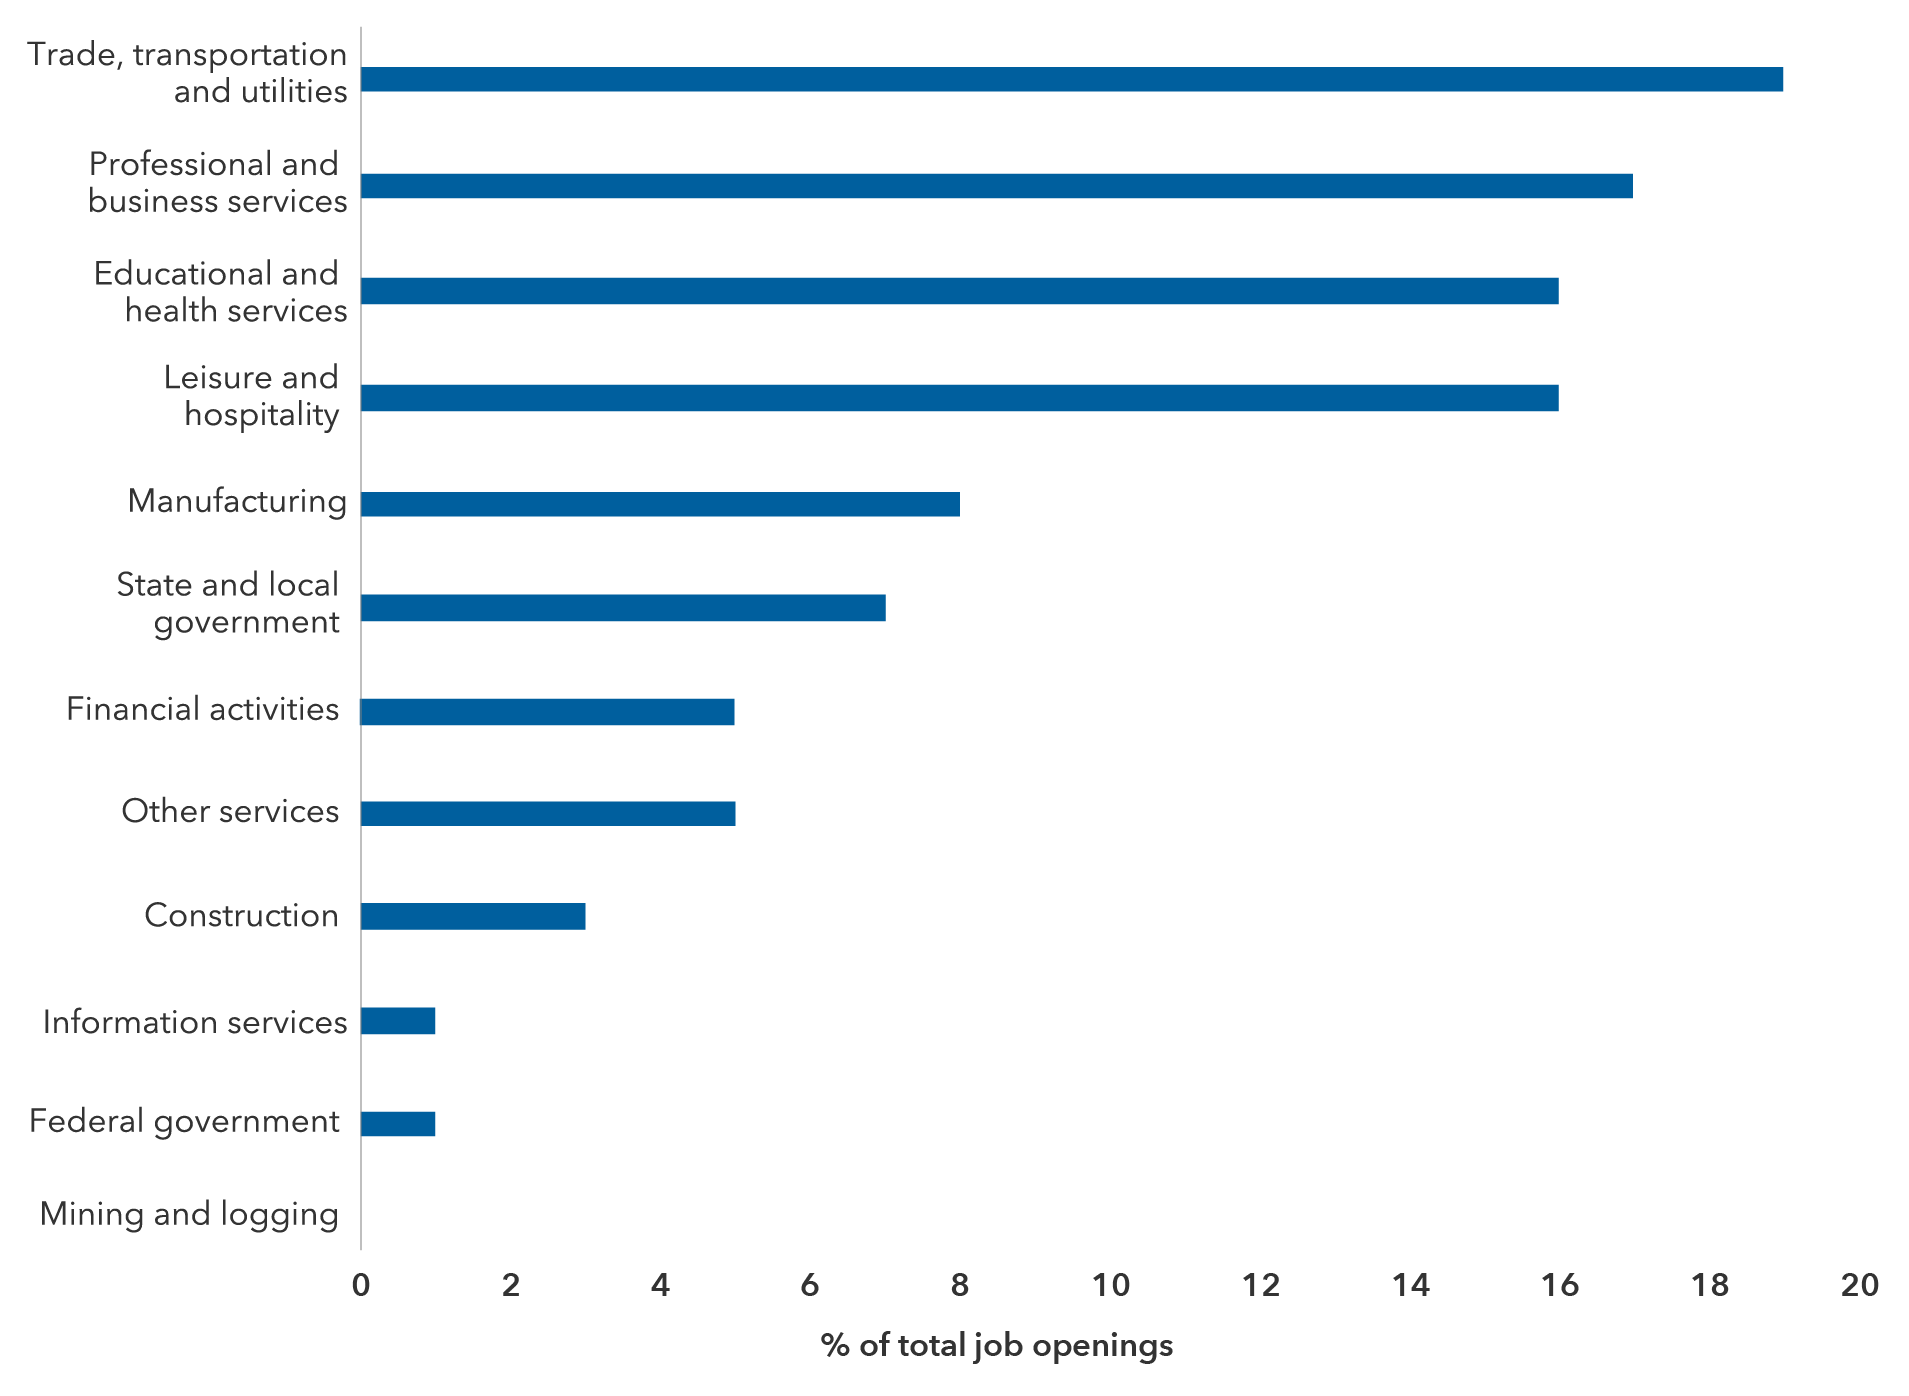
Sources: Capital Group, Haver. Data as of August 2021. Figures may not add up to 100% due to rounding.
As employers in these sectors find it easier to fill jobs, we’re likely to see a slowdown in wage gains and the one-time bonuses they have been offering to attract workers. We may even see a temporary rise in the unemployment rate, which would be a good sign if it meant that more people were coming off the sidelines and actively seeking jobs. It may turn out that the sharp drop in continuing unemployment insurance claims, which followed the expiration of federal emergency unemployment benefits in early September, will mark a turning point in the labour market recovery.
U.S. unemployment insurance claims plunged in September after peaking near 33 million
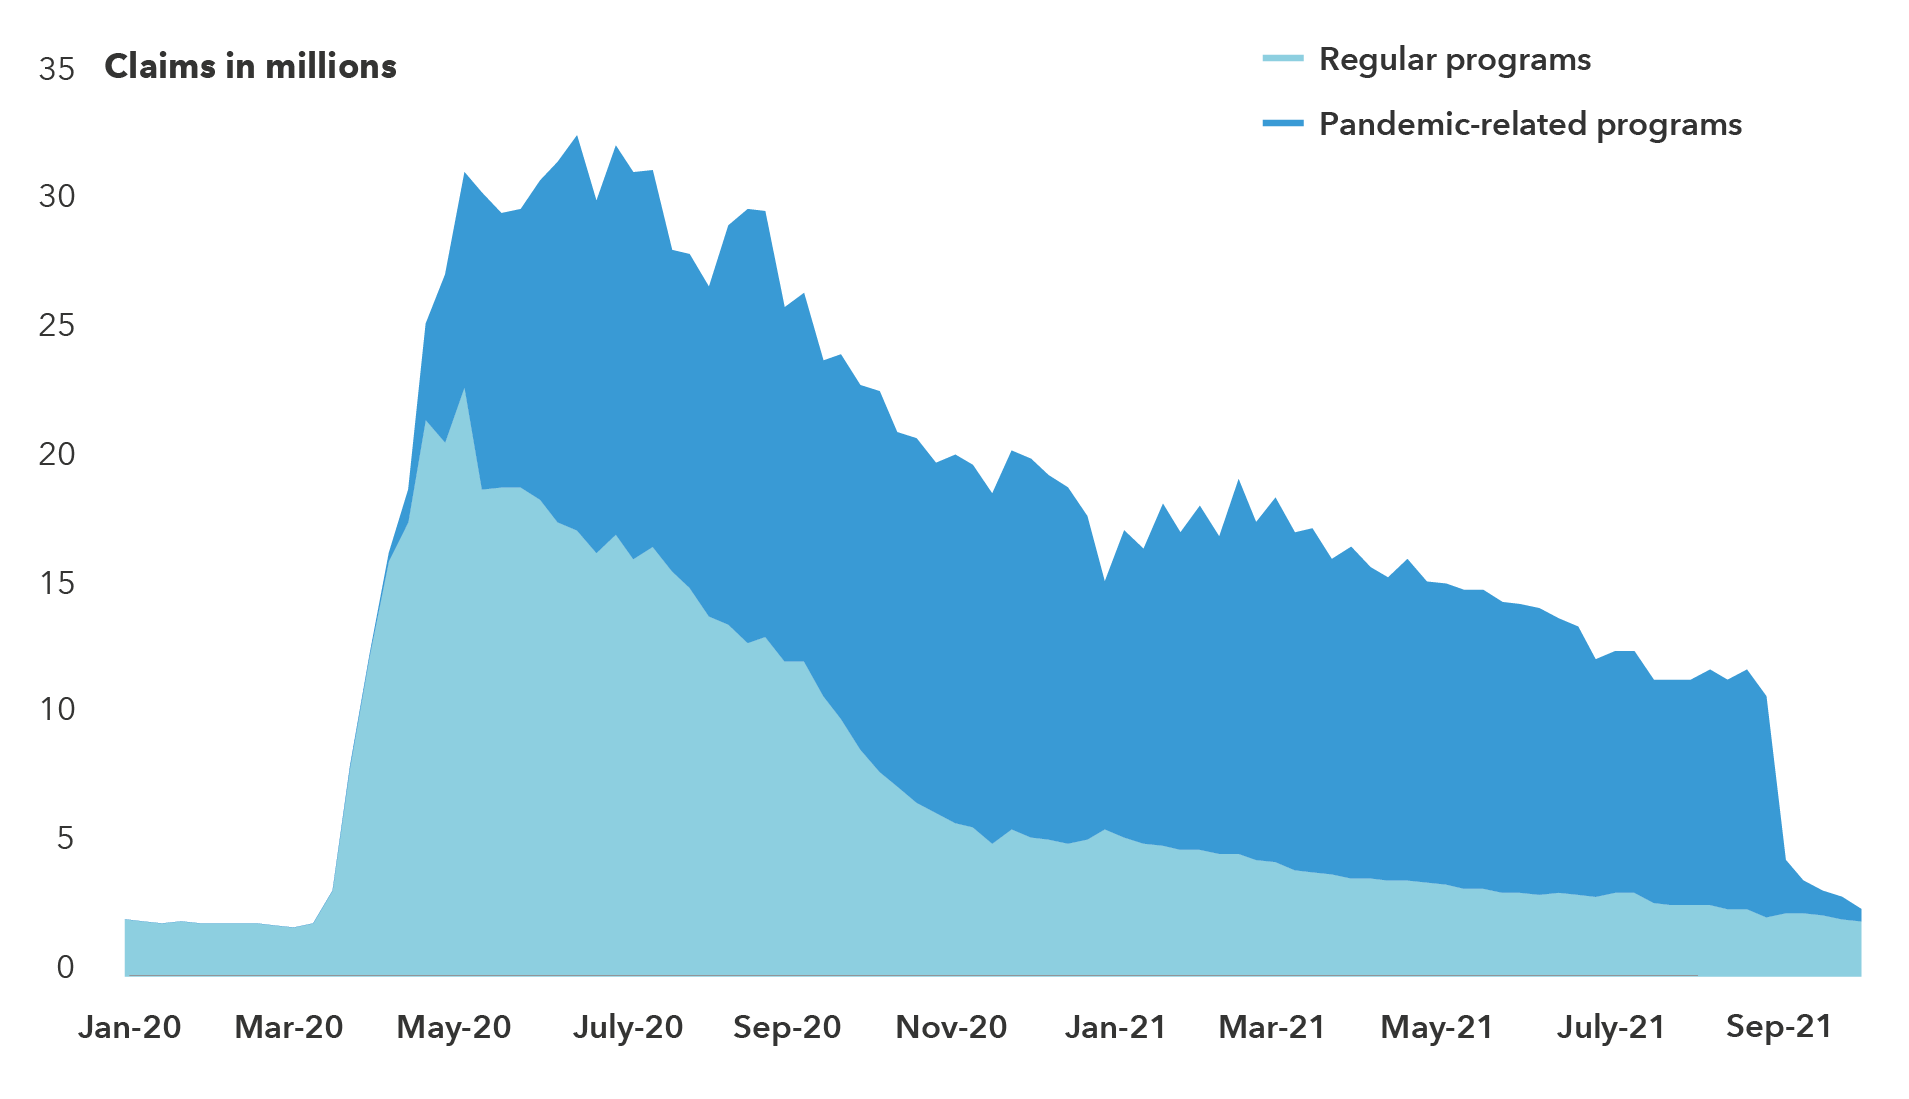
Sources: Capital Group, U.S. Department of Labor, Haver. Data as of October 9, 2021.
Structural disruption extends beyond the COVID-19–impacted sectors
However, even as some parts of the labour market normalize, a large group of workers is unlikely to respond to these cyclical improvements. The path to normalization is likely to be bumpy as millions of businesses and households reassess their demand for workers and desire for jobs, respectively. I’ve reached this conclusion after our research revealed a surprising amount of labour market disruption across multiple economic sectors, a pattern that extends well beyond pandemic-centric sectors and into areas that are more insulated from COVID-19.
A good example is the information sector, which includes publishing, broadcasting and telecommunications, among others. It has probably been least impacted — and arguably has been supported — by the pandemic because so many people have been working from home. Yet changes in the sector’s unemployment rate are consistent with the 2001 recession that followed the bursting of the dot-com bubble. And, although job openings are elevated, it is surprising that we have not seen stronger wage gains. Another sector with similar dynamics is construction, where wage gains have been strong in absolute terms. However, when measured against prior recoveries, they are less striking. The reasons for this are still unclear, and this is an area that needs more research.
Change in the information sector’s unemployment rate near dot-com crash level
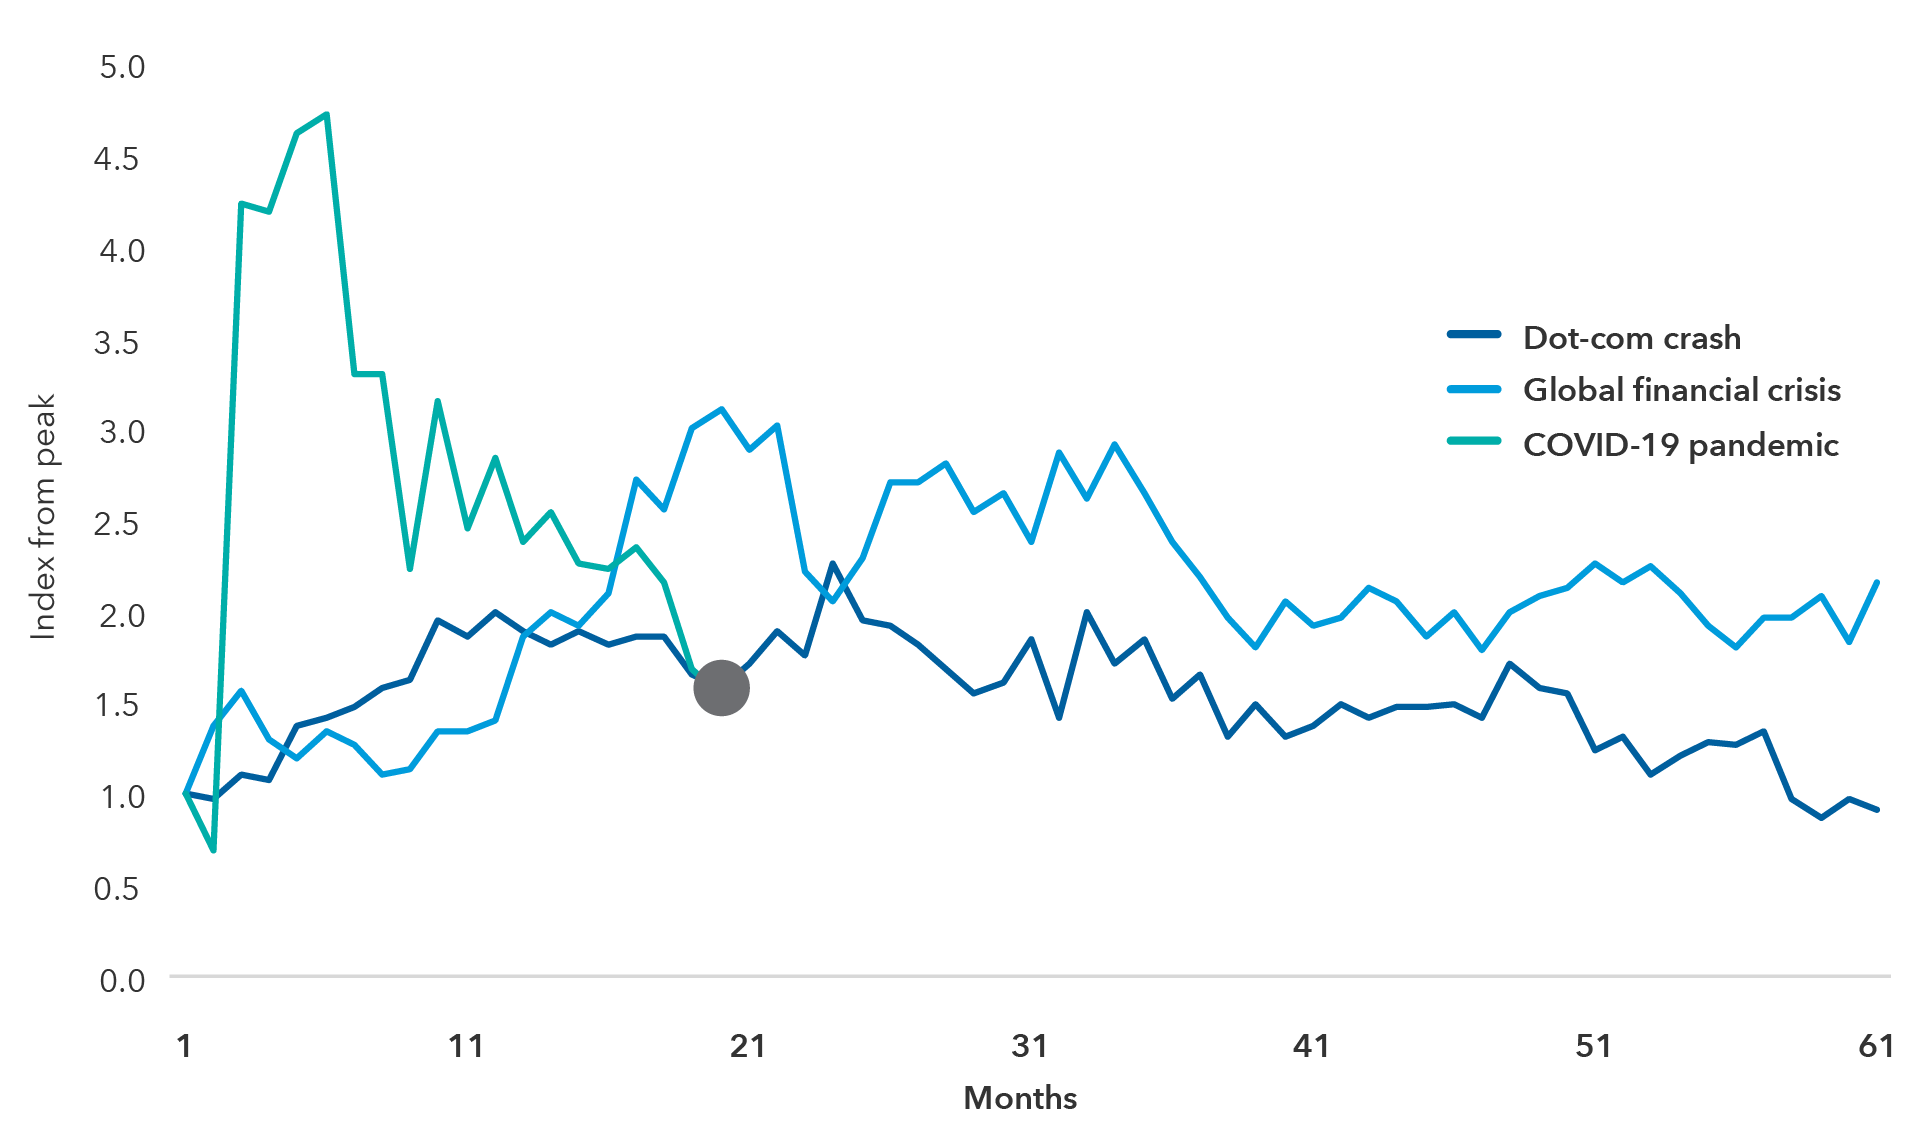
Source: U.S. Bureau of Labor Statistics. COVID-19 pandemic data as of September 2021.
Note: Chart displays changes in the U.S. unemployment rate for the information sector during three periods. All three periods shown are indexed to 1, which represents the unemployment rate in the month prior to the start of the respective recessions as determined by the National Bureau of Economic Research. The recessions began in November 2001 (dot-com crash), June 2009 (global financial crisis) and April 2020 (COVID-19 pandemic).
More broadly, it’s worth noting that the recovery in the U.S. labour force participation rate, which includes people actively entering the workforce, has been much slower than the recovery of the unemployment rate, which can move up and down a lot depending on near-term factors. This appears to support the idea that structural forces are making a full normalization of the labour market more challenging.
Fed Chair Jerome Powell acknowledged this challenge in his remarks following the Fed’s November meeting: “We thought that schools reopening and elapsing unemployment benefits would produce some sort of additional labour supply. That doesn't seem to have been the case, interestingly.” He said it was a trend the central bank would watch closely.
Structural factors could keep many out of work past 2022
What we've seen historically is that the labour market often bears the brunt of big disruptions, such as the global financial crisis. Just as some construction workers may have become baristas during the U.S. housing crisis, now it may be baristas transitioning into construction work as the hospitality sectors remain soft. These shifts take time, however, which makes me skeptical of the Fed’s base case of getting back to full employment in 2022.
Furthermore, some of the millions of job openings could be automated away rather than filled by returning workers. Think QR code menus replacing restaurant servers or machines making french fries. This is already happening to some extent, as companies adapt to the new normal and learn to function without hiring extra staff.
But automation isn’t the only thing that could keep the unemployed out of work longer. Consider those whose prospects have dimmed because they are now competing against a global workforce that is even more tightly interconnected by technology, or who now have a skill or geographic mismatch with available jobs. At the extreme are those who have reassessed their careers or accelerated retirement and are less likely to ever return to the workforce. Although many of those affected by cyclical factors are likely to return to work by early next year — barring a resurgence of COVID-19 cases — people whose reasons are more structural may not return until 2023, if at all.
Employment grinding toward a full recovery in the U.S.
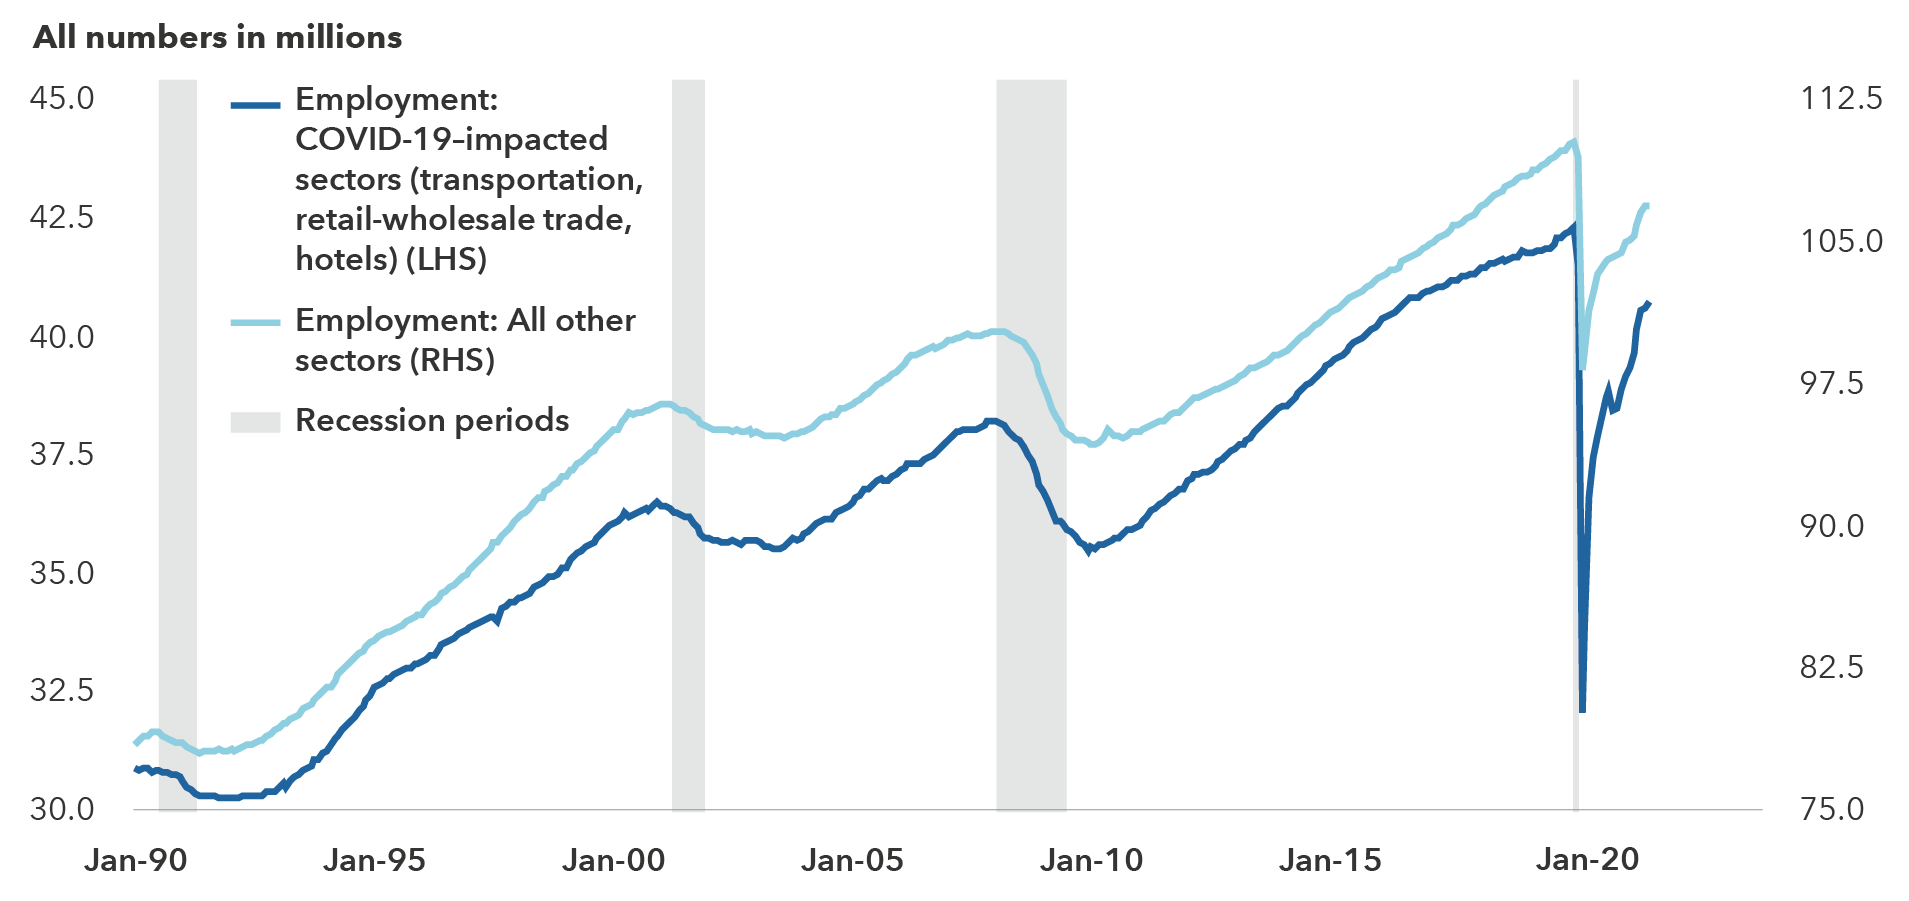
Sources: Capital Group, Haver. Data as of September 2021. Shaded areas represent recession periods as determined by the National Bureau of Economic Research.
Implications for the Fed
Today, the Federal Reserve faces a knotty challenge: Surging inflation is driving pressure for higher interest rates, which could stymie growth and weaken the labour market recovery. Unless the economy is able to absorb the large supply of labour that is currently sidelined and the labour force participation rate recovers to pre-pandemic levels, it seems unlikely that the U.S. unemployment rate will regain its pre-pandemic low of 3.5% by 2023. I think it will take until 2024.
At its November 3 meeting, the Fed confirmed that it will begin scaling back its US$120 billion-per-month asset purchase program, starting in late November. Meanwhile, the U.S. Treasury market is pricing in rate hikes by mid-2022. While the persistence of high inflation in recent data could push the Fed down that path, the challenges in labour markets could temper its pace.
Compounding the Fed’s dilemma is that a large part of the inflationary pressure is coming from supply constraints rather than demand. This pandemic shock is turning the “divine coincidence” — the idea that most negative shocks to the economy come from the demand side — on its head. In a traditional scenario, as the economy is gaining steam, the central bank can combat rising prices by lifting interest rates, which cools the economy and the labour market, in turn dampening demand. But in the current situation, lifting rates would dampen inflation but also further set back the labour market. This could create the risk of more structural dislocation in the labour market, confounding the Fed’s dual mandate of price stability and full employment.
That said, if the factors weighing on the labour market turn out to be more cyclical, the unemployment rate could be back to 3.5% more quickly than I expect and interest rates would need to be higher. In that case, the Fed may need to accelerate tightening. If it’s more structural, then the unemployment rate could remain elevated and be slow to fall. Here the Fed would be slower to raise rates.
Learn more about
Our latest insights
-
-
Demographics & Culture
-
-
Emerging Markets
-
Long-Term Investing
RELATED INSIGHTS
-
Demographics & Culture
-
Emerging Markets
-
Commissions, trailing commissions, management fees and expenses all may be associated with mutual fund investments. Please read the prospectus before investing. Mutual funds are not guaranteed, their values change frequently and past performance may not be repeated.
Unless otherwise indicated, the investment professionals featured do not manage Capital Group‘s Canadian mutual funds.
References to particular companies or securities, if any, are included for informational or illustrative purposes only and should not be considered as an endorsement by Capital Group. Views expressed regarding a particular company, security, industry or market sector should not be considered an indication of trading intent of any investment funds or current holdings of any investment funds. These views should not be considered as investment advice nor should they be considered a recommendation to buy or sell.
Statements attributed to an individual represent the opinions of that individual as of the date published and do not necessarily reflect the opinions of Capital Group or its affiliates. This information is intended to highlight issues and not be comprehensive or to provide advice. For informational purposes only; not intended to provide tax, legal or financial advice. We assume no liability for any inaccurate, delayed or incomplete information, nor for any actions taken in reliance thereon. The information contained herein has been supplied without verification by us and may be subject to change. Capital Group funds are available in Canada through registered dealers. For more information, please consult your financial and tax advisors for your individual situation.
Forward-looking statements are not guarantees of future performance, and actual events and results could differ materially from those expressed or implied in any forward-looking statements made herein. We encourage you to consider these and other factors carefully before making any investment decisions and we urge you to avoid placing undue reliance on forward-looking statements.
The S&P 500 Composite Index (“Index”) is a product of S&P Dow Jones Indices LLC and/or its affiliates and has been licensed for use by Capital Group. Copyright © 2024 S&P Dow Jones Indices LLC, a division of S&P Global, and/or its affiliates. All rights reserved. Redistribution or reproduction in whole or in part are prohibited without written permission of S&P Dow Jones Indices LLC.
FTSE source: London Stock Exchange Group plc and its group undertakings (collectively, the "LSE Group"). © LSE Group 2024. FTSE Russell is a trading name of certain of the LSE Group companies. "FTSE®" is a trade mark of the relevant LSE Group companies and is used by any other LSE Group company under licence. All rights in the FTSE Russell indices or data vest in the relevant LSE Group company which owns the index or the data. Neither LSE Group nor its licensors accept any liability for any errors or omissions in the indices or data and no party may rely on any indices or data contained in this communication. No further distribution of data from the LSE Group is permitted without the relevant LSE Group company's express written consent. The LSE Group does not promote, sponsor or endorse the content of this communication. The index is unmanaged and cannot be invested in directly.
BLOOMBERG® is a trademark and service mark of Bloomberg Finance L.P. and its affiliates (collectively “Bloomberg”). Bloomberg or Bloomberg’s licensors own all proprietary rights in the Bloomberg Indices. Neither Bloomberg nor Bloomberg’s licensors approves or endorses this material, or guarantees the accuracy or completeness of any information herein, or makes any warranty, express or implied, as to the results to be obtained therefrom and, to the maximum extent allowed by law, neither shall have any liability or responsibility for injury or damages arising in connection therewith.
MSCI does not approve, review or produce reports published on this site, makes no express or implied warranties or representations and is not liable whatsoever for any data represented. You may not redistribute MSCI data or use it as a basis for other indices or investment products.
Capital believes the software and information from FactSet to be reliable. However, Capital cannot be responsible for inaccuracies, incomplete information or updating of the information furnished by FactSet. The information provided in this report is meant to give you an approximate account of the fund/manager's characteristics for the specified date. This information is not indicative of future Capital investment decisions and is not used as part of our investment decision-making process.
Indices are unmanaged and cannot be invested in directly. Returns represent past performance, are not a guarantee of future performance, and are not indicative of any specific investment.
All Capital Group trademarks are owned by The Capital Group Companies, Inc. or an affiliated company in Canada, the U.S. and other countries. All other company names mentioned are the property of their respective companies.
Capital Group funds are offered in Canada by Capital International Asset Management (Canada), Inc., part of Capital Group, a global investment management firm originating in Los Angeles, California in 1931. Capital Group manages equity assets through three investment groups. These groups make investment and proxy voting decisions independently. Fixed income investment professionals provide fixed income research and investment management across the Capital organization; however, for securities with equity characteristics, they act solely on behalf of one of the three equity investment groups.
The Capital Group funds offered on this website are available only to Canadian residents.