Technology & Innovation
Categories
Bonds
Bond outlook: What to know as U.S. Fed fears hit markets
 Ritchie Tuazon
 Tara Torrens
June 16, 2022
The path to higher interest rates is painful, but it should ultimately benefit bond investors over the long haul.
The U.S. Federal Reserve raised its benchmark policy rate by 0.75% to 1.50%–1.75%, the biggest increase since 1994. The central bank also signaled an additional 1.75% of increases ahead. Policymakers specifically raised the median year-end projection for the Fed funds rate to a range between 3.25% and 3.50%.
U.S. bonds have tumbled more than 10% in USD so far this year, but there are signs the worst may be over. Investors have several reasons to own bonds as the Fed attempts to steer the economy toward a much-debated soft landing.
1. Big declines may bring opportunities
Bond investors have snapped up debt as prices declined sharply on fears the Fed’s effort to tame inflation could severely strain economic growth. The buying spree helped most bond sectors post positive returns in May.
Questions that drove volatility remain, but now may be an opportune time to turn anxiety into action. “Equity market swings will likely continue, but bond markets are unlikely to decline another 10% from here,” says fixed income portfolio manager Ritchie Tuazon.
The downward selling pressure has brought valuations for most bonds back to Earth and more in line with expectations. This may provide an attractive entry point for investors.
Exposure to high-quality bond funds can again offer the diversification investors want, especially amid heightened equity volatility. Investors can also seek opportunities across bond sectors to achieve investment goals such as income and inflation protection.
2. Current bond yields largely account for inflation-driven rate hikes
The Fed’s rate hikes and balance sheet reductions suggest a focus on bringing down inflation. But there is still work to do.
The U.S. consumer price index jumped 8.6% for the year through May and is up 1% from April. Core inflation, which excludes food and energy, rose 0.6% from the prior month.
Prices for services in the U.S. soar, which may be harder to tame
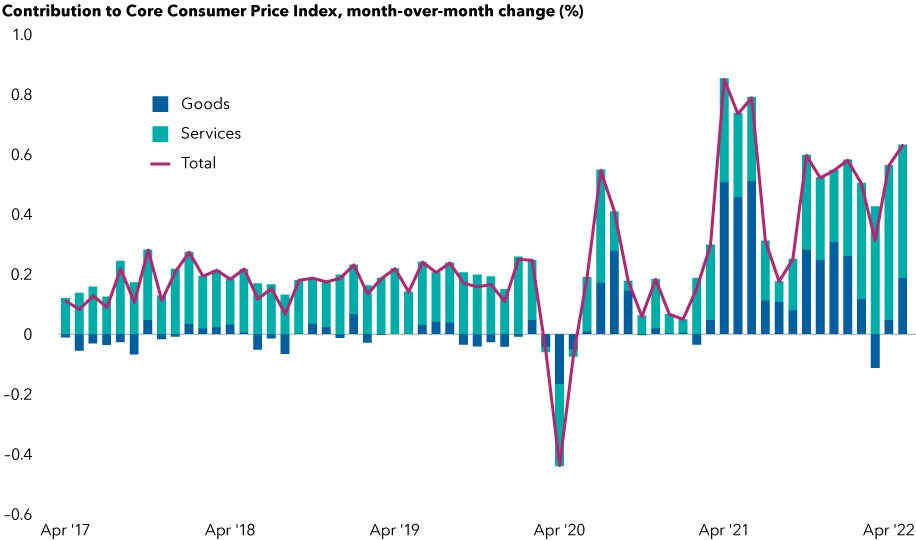
Source: U.S. Bureau of Labor Statistics. As of 5/31/2022.
The overall number is worrisome. “I think the Fed is still behind the curve on rate hikes,” Tuazon adds.
Prices in the U.S. likely peaked for some items that surged in demand during COVID lockdowns. Case in point: Lumber prices jumped alongside home sales and renovations during the pandemic but have slid 50% from the start of the year. However, prices for services and necessities such as food, housing and energy have skyrocketed. “It may be a case of one replacing the other, keeping inflation high,” Tuazon notes.
Persistent inflation may force the Fed to revise its rates path higher. However, since investors have mostly priced bonds to account for the more aggressive plan, future adjustments are unlikely to result in as much bond market turmoil.
Over the next year, bond yields are less likely to climb as much as they have since July 2021, when markets began to worry about elevated inflation.
U.S. Treasury yield expectations show rate hikes are largely priced in
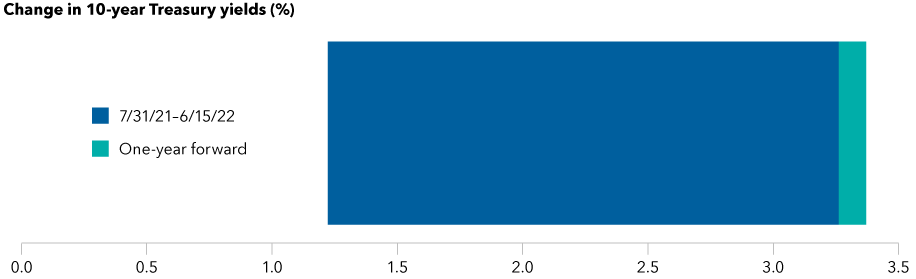
Source: Bloomberg. As of 6/15/2022.
3. Income is back in fixed income
Investors may soon be able to cash in on higher rates.
The yield on the 10-year U.S. Treasury hit 3.48% in mid-June, the highest close since April 2011. Yields, which rise when bond prices fall, have jumped across bond sectors. Over time, rising yields mean more income from bonds.
Income opportunity in bonds is the brightest in years
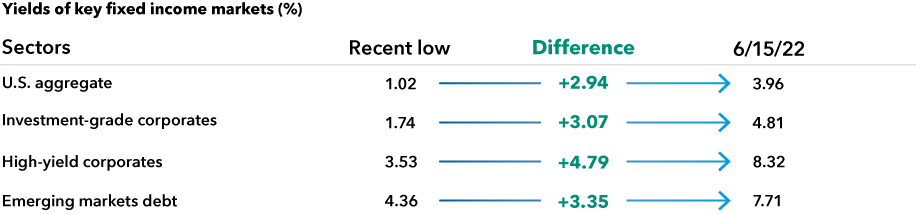
Sources: Bloomberg, Bloomberg Index Services Ltd., JP Morgan, Federal Reserve. As of 6/15/22. Sector yields above include Bloomberg U.S. Aggregate Bond Index, Bloomberg U.S. Corporate Investment Grade Index, Bloomberg U.S. Corporate High Yield Index, and 50% J.P. Morgan EMBI Global Diversified Index/50% J.P. Morgan GBI-EM Global Diversified Index blend. Period of time considered from 2020 to present. Dates for lows from top to bottom in chart shown are: 8/4/20, 12/31/20, 7/6/21 and 1/4/21.
There are still pitfalls ahead, so an active approach might help. While a recession does not appear imminent, credit spreads may widen as investors forecast the likelihood of one, says fixed income portfolio manager Tara Torrens.
Certain industries that are defensive in nature, such as health care and food, may offer more value in this environment. Commodities companies can also offer refuge in a late-cycle period. “There are always opportunities, but I’m maintaining a lot of liquidity that could then be redeployed if we see the type of spread widening that I’m expecting,” Torrens says.
Emerging markets debt — a corner of the bond market that has been especially volatile — offers some opportunities as well. Several countries have raised rates ahead of the Fed and are on good financial footing, according to fixed income portfolio manager, Rob Neithart. Given the nuances of emerging markets investing, an active approach can help steer investors toward select investment ideas.
4. Current yields have delivered attractive returns
At today’s yields, history suggests higher total returns in the future. This means that investors could benefit from holding bonds across fixed income asset classes, including high yield.
Higher yields have boosted total returns
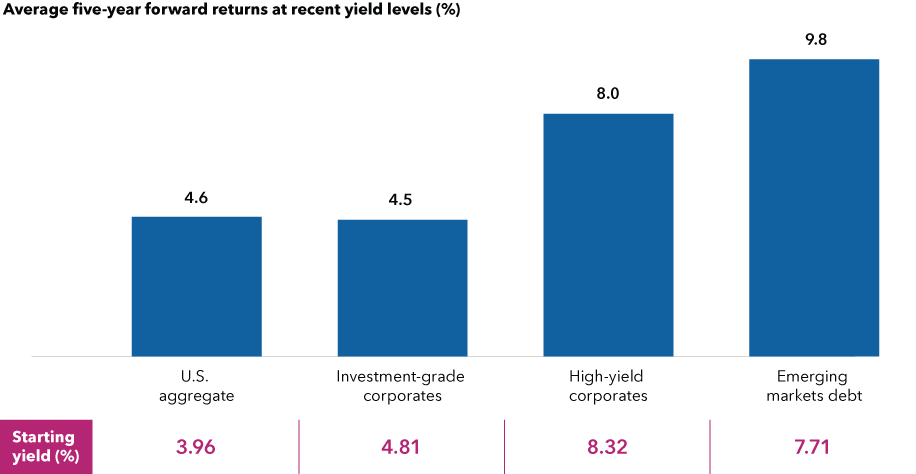
Sources: Capital Group, Bloomberg, J.P. Morgan. Yields as of June 15, 2022. Monthly return data as of May 31, 2022, going back to January 2000, for all sectors except for emerging markets debt, which goes back to January 2003. Based on average monthly returns for each sector when in a +/–0.30% range of yield-to-worst shown. Sector yields above include Bloomberg U.S. Aggregate Index, Bloomberg U.S. Investment Grade Corporate Index, Bloomberg U.S. Corporate High Yield Index, 50% J.P. Morgan EMBI Global Diversified Index/50% J.P. Morgan GBI-EM Global Diversified Index blend. Past results are not predictive of results in future periods. Returns are in USD.
“Average annual returns for the high-yield market historically are approximately 6% to 8%. We are again at a starting yield level where these returns could be achieved, with a multi-year investment horizon, which is the first time this has been true in a while,” Torrens says.
Why own bonds now?
Investors have a lot to be pessimistic about: war in Ukraine, inflation and fears of a looming recession. Big declines occurred as investors feared the Fed could crimp growth as it raises rates and ends its asset purchases.
Although risks remain, bond investors have largely priced in rate hikes. Now could be an attractive entry point, particularly for those using bonds to buffer equity volatility.
“There’s a lot to be positive about despite all the negative headlines,” Tuazon says. “While past results are no guarantee of future outcomes, a long-term perspective can help investors recognize that yields at current levels have historically delivered more income and attractive returns.”
Learn more about
Bloomberg U.S. Aggregate Bond Index represents the U.S. investment-grade fixed-rate bond market.
Bloomberg U.S. Corporate High Yield Index covers the universe of fixed-rate, non-investment-grade debt.
Bloomberg U.S. Corporate Investment Grade Index represents the universe of investment grade, publicly issued U.S. corporate and specified foreign debentures and secured notes that meet the specified maturity, liquidity, and quality requirements.
The J.P. Morgan Emerging Market Bond Index (EMBI) Global Diversified is a uniquely weighted emerging market debt benchmark that tracks total returns for U.S. dollar-denominated bonds issued by emerging market sovereign and quasi-sovereign entities. J.P. Morgan Government Bond Index — Emerging Markets (GBI-EM) Global Diversified covers the universe of regularly traded, liquid fixed-rate, domestic currency emerging market government bonds to which international investors can gain exposure. The 50%/50% JP Morgan EMBI Global/JP Morgan GBI-EM Global Diversified blends the JP Morgan EMBI Global Index with the JP Morgan GBI-EM Global Diversified Index by weighting their cumulative total returns at 50% each. This assumes the blend is rebalanced monthly.
This report, and any product, index or fund referred to herein, is not sponsored, endorsed or promoted in any way by J.P. Morgan or any of its affiliates who provide no warranties whatsoever, express or implied, and shall have no liability to any prospective investor, in connection with this report.
Our latest insights
-
-
Demographics & Culture
-
-
Emerging Markets
-
Long-Term Investing
RELATED INSIGHTS
-
Technology & Innovation
-
Long-Term Investing
-
Demographics & Culture
Commissions, trailing commissions, management fees and expenses all may be associated with mutual fund investments. Please read the prospectus before investing. Mutual funds are not guaranteed, their values change frequently and past performance may not be repeated.
Unless otherwise indicated, the investment professionals featured do not manage Capital Group‘s Canadian mutual funds.
References to particular companies or securities, if any, are included for informational or illustrative purposes only and should not be considered as an endorsement by Capital Group. Views expressed regarding a particular company, security, industry or market sector should not be considered an indication of trading intent of any investment funds or current holdings of any investment funds. These views should not be considered as investment advice nor should they be considered a recommendation to buy or sell.
Statements attributed to an individual represent the opinions of that individual as of the date published and do not necessarily reflect the opinions of Capital Group or its affiliates. This information is intended to highlight issues and not be comprehensive or to provide advice. For informational purposes only; not intended to provide tax, legal or financial advice. We assume no liability for any inaccurate, delayed or incomplete information, nor for any actions taken in reliance thereon. The information contained herein has been supplied without verification by us and may be subject to change. Capital Group funds are available in Canada through registered dealers. For more information, please consult your financial and tax advisors for your individual situation.
Forward-looking statements are not guarantees of future performance, and actual events and results could differ materially from those expressed or implied in any forward-looking statements made herein. We encourage you to consider these and other factors carefully before making any investment decisions and we urge you to avoid placing undue reliance on forward-looking statements.
The S&P 500 Composite Index (“Index”) is a product of S&P Dow Jones Indices LLC and/or its affiliates and has been licensed for use by Capital Group. Copyright © 2024 S&P Dow Jones Indices LLC, a division of S&P Global, and/or its affiliates. All rights reserved. Redistribution or reproduction in whole or in part are prohibited without written permission of S&P Dow Jones Indices LLC.
FTSE source: London Stock Exchange Group plc and its group undertakings (collectively, the "LSE Group"). © LSE Group 2024. FTSE Russell is a trading name of certain of the LSE Group companies. "FTSE®" is a trade mark of the relevant LSE Group companies and is used by any other LSE Group company under licence. All rights in the FTSE Russell indices or data vest in the relevant LSE Group company which owns the index or the data. Neither LSE Group nor its licensors accept any liability for any errors or omissions in the indices or data and no party may rely on any indices or data contained in this communication. No further distribution of data from the LSE Group is permitted without the relevant LSE Group company's express written consent. The LSE Group does not promote, sponsor or endorse the content of this communication. The index is unmanaged and cannot be invested in directly.
BLOOMBERG® is a trademark and service mark of Bloomberg Finance L.P. and its affiliates (collectively “Bloomberg”). Bloomberg or Bloomberg’s licensors own all proprietary rights in the Bloomberg Indices. Neither Bloomberg nor Bloomberg’s licensors approves or endorses this material, or guarantees the accuracy or completeness of any information herein, or makes any warranty, express or implied, as to the results to be obtained therefrom and, to the maximum extent allowed by law, neither shall have any liability or responsibility for injury or damages arising in connection therewith.
MSCI does not approve, review or produce reports published on this site, makes no express or implied warranties or representations and is not liable whatsoever for any data represented. You may not redistribute MSCI data or use it as a basis for other indices or investment products.
Capital believes the software and information from FactSet to be reliable. However, Capital cannot be responsible for inaccuracies, incomplete information or updating of the information furnished by FactSet. The information provided in this report is meant to give you an approximate account of the fund/manager's characteristics for the specified date. This information is not indicative of future Capital investment decisions and is not used as part of our investment decision-making process.
Indices are unmanaged and cannot be invested in directly. Returns represent past performance, are not a guarantee of future performance, and are not indicative of any specific investment.
All Capital Group trademarks are owned by The Capital Group Companies, Inc. or an affiliated company in Canada, the U.S. and other countries. All other company names mentioned are the property of their respective companies.
Capital Group funds are offered in Canada by Capital International Asset Management (Canada), Inc., part of Capital Group, a global investment management firm originating in Los Angeles, California in 1931. Capital Group manages equity assets through three investment groups. These groups make investment and proxy voting decisions independently. Fixed income investment professionals provide fixed income research and investment management across the Capital organization; however, for securities with equity characteristics, they act solely on behalf of one of the three equity investment groups.
The Capital Group funds offered on this website are available only to Canadian residents.